Market Condition Evaluation based on standard indicators in Metatrader 5 - page 181
You are missing trading opportunities:
- Free trading apps
- Over 8,000 signals for copying
- Economic news for exploring financial markets
Registration
Log in
You agree to website policy and terms of use
If you do not have an account, please register
Forum on trading, automated trading systems and testing trading strategies
Press review
Sergey Golubev, 2016.07.12 07:00
AUD/USD Intra-Day Fundamentals: National Australia Bank Business Confidence and 44 pips price movement
2016-07-12 01:30 GMT | [AUD - NAB Business Confidence]
if actual > forecast (or previous one) = good for currency (for AUD in our case)
[AUD - NAB Business Confidence] = Level of a diffusion index based on surveyed businesses, excluding the farming industry.
==========
Business confidence rises despite Brexit, election campaign :==========
AUD/USD M5: 44 pips price movement by National Australia Bank Business Confidence news event :
Forum on trading, automated trading systems and testing trading strategies
Press review
Sergey Golubev, 2016.07.13 16:21
USD/CAD Intra-Day Fundamentals: Bank of Canada Overnight Rate, BoC Monetary Policy Report and 101 pips price movement
2016-07-13 14:00 GMT | [CAD - Overnight Rate]
if actual > forecast (or previous one) = good for currency (for CNY in our case)
[CAD - Overnight Rate] = Interest rate at which major financial institutions borrow and lend overnight funds between themselves.
==========
"Overall, the risks to the profile for inflation are roughly balanced, although the implications of the Brexit vote are highly uncertain and difficult to forecast. At the same time, financial vulnerabilities are elevated and rising, particularly in the greater Vancouver and Toronto areas. The Bank’s Governing Council judges that the overall balance of risks remains within the zone for which the current stance of monetary policy is appropriate, and the target for the overnight rate remains at 1/2 per cent."==========
USD/CAD M5: 101 pips price movement by Bank of Canada Overnight Rate news event :
Forum on trading, automated trading systems and testing trading strategies
Forecast for Q3'16 - levels for Brent Crude Oil
Sergey Golubev, 2016.07.13 16:52
U.S. Commercial Crude Oil Inventories news event: intra-day bearish breakdown; daily ranging for direction
2016-07-13 14:30 GMT | [USD - Crude Oil Inventories]
[USD - Crude Oil Inventories] = Change in the number of barrels of crude oil held in inventory by commercial firms during the past week.
==========
"U.S. commercial crude oil inventories (excluding those in the Strategic Petroleum Reserve) decreased by 2.3 million barrels from the previous week."
==========
Crude Oil M5: bounced from 200 SMA to below for the bearish breakdown. The price was bounced from 200 SMA for the bearish breakdown. Price is testing 46.78 support level for the bearish trend to be continuing, otherwise - ranging bearish.
Crude Oil Daily: ranging within Ichimoku cloud for direction. The price is located inside Ichimoku cloud for the ranging condition in the bullish area of the chart to be near and above Senkou Span line which is the virtual border between the primary bearish and the primary bullish trend.
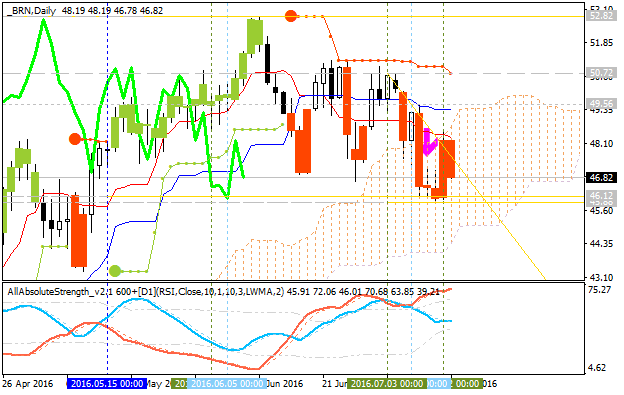
If the price breaks 52.82 resistance on close daily bar so the primary bullish trend will be continuing.If the price breaks 45.88 support level on close daily bar so the reversal of the price movement from the ranging bullish to the primary bearish market condition will be started.
If not so the price will be on bullish ranging within the levels.
Forum on trading, automated trading systems and testing trading strategies
EURUSD Technical Analysis 2016, 10.07 - 17.07: ranging bearish
Sergey Golubev, 2016.07.14 15:12
M5 price is on the secondary correction within the primary bullish market condition: price is testing 1.1109 support level together with 200 period SMA to below for the reversal of the price movement to the primary bearish market condition.
H4 price is on bear market rally: the price broke 100 SMA to above and it is located within 100 SMA/200 SMA bearish ranging area waiting for the direction of the bearish trend to be resumed or the bullish reversal to be started. Key resistance at 1.1185 is the bullish reversal level, and key level at 1.1082 is the bearish continuation support.
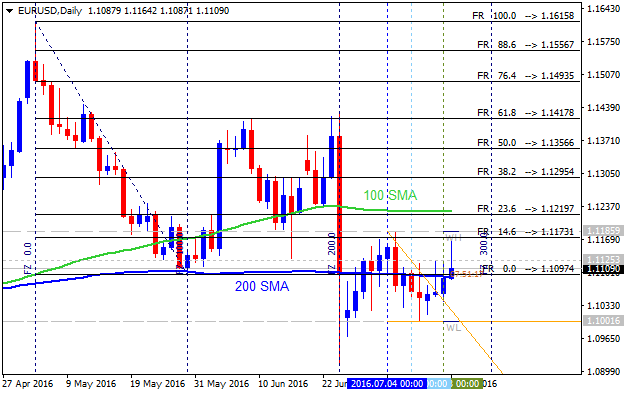
Daily price is on ranging around 200-day SMA waiting for direction:
If the price breaks 1.1219 resistance level on close daily bar so the primary bullish trend will be resumed.
If the price breaks 1.1001 support level on daily close bar so the bearish market condition will be started.
If not so the price will be on the ranging condition.
Forum on trading, automated trading systems and testing trading strategies
Forecast for Q3'16 - levels for USD/JPY
Sergey Golubev, 2016.07.15 17:23
H4 price broke 200 SMA to be reversed to the primary bullish market condition: the price is testing 106.31 resistance level for the bullish trend to be continuing. Alternative, if the price breaks 104.81 support level to below so the bearish trend will be resumed.
Forum on trading, automated trading systems and testing trading strategies
USDCAD Technical Analysis 2016, 17.07 - 24.07: bullish ranging near bearish reversal
Sergey Golubev, 2016.07.16 09:53
Daily price is on bullish condition to be on ranging near and above Senkou Span line which si the virtual border between the primary ebarish and the primary bullish trend on the daily chart. The price is located within the following key support/resistance levels:
Chinkou Span line is located above ther price for the bullish condition with the secondary ranging by the direction, and Absolute Strength indicator si estimating the trend to be on ranging in the near future.
If D1 price breaks 1.2836 support level on close bar so the bearish reversal will be started.If D1 price breaks 1.3139 resistance level on close bar from below to above so the primary bullish trend will be resumed.
If not so the price will be on ranging within the levels.
TREND : rangingSUMMARY : bullish ranging near bearish reversal
Forum on trading, automated trading systems and testing trading strategies
EURUSD Technical Analysis 2016, 17.07 - 24.07: bearish breakdown to be started with 1.1001 support level to be broken
Sergey Golubev, 2016.07.16 09:29
Daily price is on bearish breakdown to be started on open D1 bar for now: the price is testing 1.1001 support level to below for the bearish breakdown to be continuing.
If D1 price breaks 1.1001 support level on close bar so the bearish trend will be continuing up to 1.0911 level to re-enter.
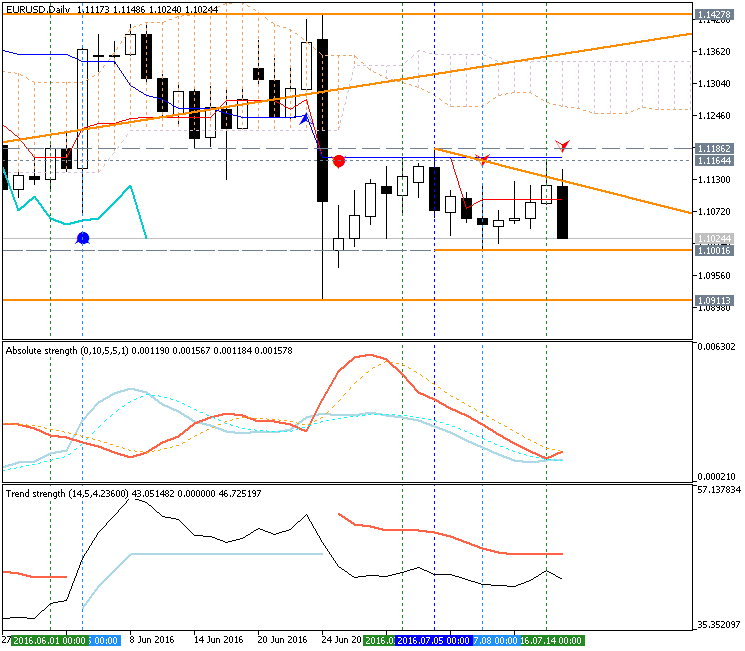
If D1 price breaks 1.1186 resistance level on close bar from below to above so the local uptrend as the bear market rally will be started.
If D1 price will break Senkou Span line at 1.1343 on close bar so the reversal of the price movement to the primary bullish market condition will be started.
If not so the price will be on ranging bearish within the levels.
SUMMARY : bearish breakdown to be started
TREND : bearishjust joining the forum. Anyone got any good systems they use? I prefer not to sit in front of computer all the time so just 1-2 good trades a day is all really looking for.
Also any nadex traders here?
Forum on trading, automated trading systems and testing trading strategies
Press review
Sergey Golubev, 2016.07.19 07:30
Trading News Events: U.K. Consumer Price Index (adapted from the article)
2016-07-19 08:30 GMT | [GBP - CPI]
if actual > forecast (or previous one) = good for currency (for GBP in our case)
[GBP - CPI] = Change in the price of goods and services purchased by consumers.
==========
What’s Expected:Why Is This Event Important:
"With the U.K. preparing to depart from the European Union (EU), there’s growing speculation the BoE will reestablish its easing cycle at the next interest-rate decision on August 4, but we may see another split decision to retain the current policy as the marked depreciation in the British Pound raises the risk of overshooting the 2% target for inflation."
==========
GBP/USD H1: ranging below Ichimoku cloud. The price is located below Ichimoku cloud in the bearish area of the chart for the ranging within the following key support/resistance levels:
Chinkou Span line and Absolute Strength indicator are estimating the trend as the secondary ranging, and Trend Strength indicator is evaluating the market condition as the bearish in the near future.
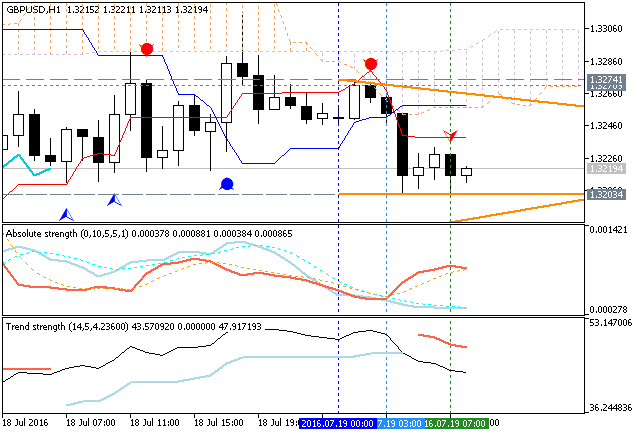
If the price breaks 1.3203 support level to below on close H1 bar so the primary bearish trend will be continuing.
If the price breaks 1.3274 resistance to above on close H1 bar so the reversal of the price movement from the ranging bearish to the primary bullish market condition will be started.
If not so the price will be continuing with the ranging within the levels.
Forum on trading, automated trading systems and testing trading strategies
Forecast for Q3'16 - levels for DAX Index
Sergey Golubev, 2016.07.19 21:06
DAX Index Technical Analysis: daily ranging inside Ichimoku cloud waiting for direction of the trend
Daily price is on ranging inside Ichimoku cloud waiting for the direction of the trend to be started within the following key reversal support/resistance levels:
- 10152.6 resistance level located above Ichimoku cloud in the beginning of the primary bullish trend on the chart, and
- 9783.1 support level located below Ichimoku cloud in the beginning of the primary bearish trend.
Absolute Strength indicator together with Chinkou Span line are estimating the ranging market condition in the near future.If D1 price breaks 9783.1 support level on close bar so the primary bearish trend will be resumed with 9351.0 possible bearish target.
If D1 price breaks 10152.6 resistance level on close bar so the reversal of the price movement to the primary bullish market condition will be started with 10372.5 possible bullish target to re-enter.
If not so the price will be on ranging within the levels.
SUMMARY : ranging
TREND : waiting for direction