Forum on trading, automated trading systems and testing trading strategies
Sergey Golubev, 2016.07.16 11:34
Fundamental Weekly Forecasts for Dollar Index, GBP/USD, USD/CAD, USD/JPY, NZD/USD, AUD/USD, USD/CNH and GOLD (based on the article)
USD/CAD - "The BoC argued ‘inflation has recently been a little higher than anticipated, largely due to higher consumer energy prices,’ and a stronger-than-expected CPI report may spur a further shift in the monetary policy outlook especially as the central bank anticipates a ‘pickup in growth over the projection horizon.’ With that said, Governor Poloz may adopt a hawkish tone over the coming months should the key data prints coming out of the Canadian economy boost the outlook for growth and inflation."
Daily price is located below 200-day SMA with the symmetric triangle pattern to be crossed to below for the bearish trend to be continuing. If the price breaks 1.3284 resistance level to above so the bullish reversal will be started, if the price breaks 1.2654 support level to below so the bearish trend will be continung with 1.2460 level as a nearest daily bearish target, otherwise - ranging bearish.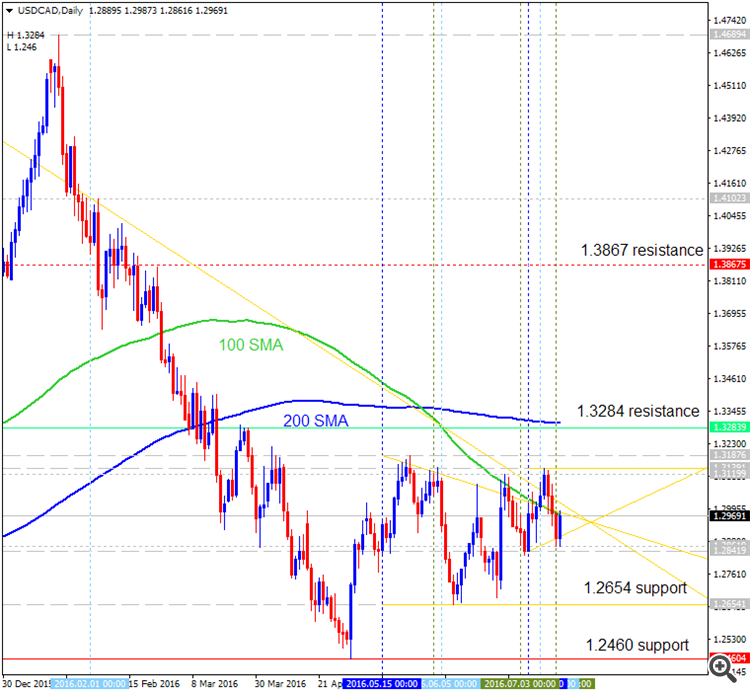
USD/CAD Technical Analysis - intra-day bullish breakout, daily bullish trend to be resumed, weekly possible bullish reversal
Daily price is on bullish condition to be above Ichimoku cloud with the ranging within the following key support/resistance levels:
- 1.2860 support level located in the beginning of the bearish trend to be started, and
- 1.3139 resistance level located above Ichimoku cloud in the primary bullish trend on the chart.
Chinkou Span line
and Absolute Strength indicator are estimating the bullish condition to be continuing.
If D1 price breaks 1.3139 resistance level on close bar from below to above so the primary bullish trend will be continuing.
If not so the price will be on ranging within the levels.
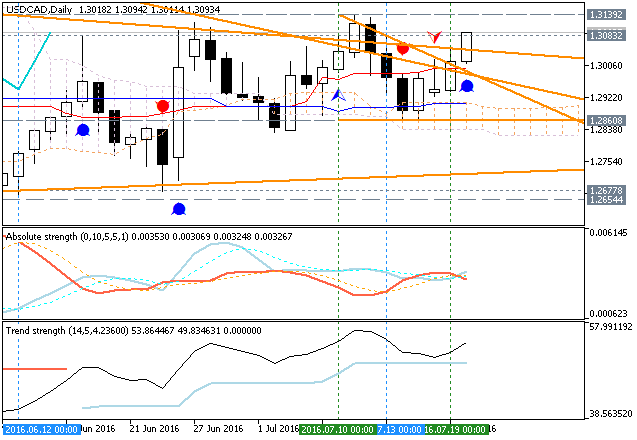
- Recommendation for long: watch close D1 price to break 1.3139 for possible buy trade
- Recommendation
to go short: watch D1 price to break 1.2860 support level for possible sell trade
- Trading Summary: ranging
| Resistance | Support |
|---|---|
| 1.3083 | 1.2860 |
| 1.3139 | 1.2654 |
Forum on trading, automated trading systems and testing trading strategies
Sergey Golubev, 2016.07.22 11:44
Trading News Events: Canada Consumer Price Index (adapted from the article)
2016-07-22 12:30 GMT | [CAD - CPI core]
- past data is 0.3%
- forecast data is 0.0%
- actual data is n/a according to the latest press release
if actual > forecast (or previous one) = good for currency (for CAD in our case)
[CAD - CPI core] = Change in the price of goods and services purchased by consumers, excluding the 8 most volatile items.
==========
What’s Expected:Why Is This Event Important:
"Even though BoC Governor Stephen Poloz largely endorses a wait-and-see
approach for monetary policy, the central bank may keep the door open to
further reduce the benchmark interest rate as the Canadian economy
continues to adjust to the oil-price shock."
- "USD/CAD may continue to face range-bound prices as it largely preserves
the wedge/triangle formation from earlier this year, with the pair
capped around 1.3130 (38.2% retracement), while near-term support comes
in around 1.2620 (50% retracement) to 1.2650 (50% retracement)."
- Key Resistance: "1.3560 (100% expansion) to 1.3630 (38.2% retracement)."
- Key Support: "1.2510 (78.6% retracement) to 1.2520 (38.2% expansion)."
- Bearish trade: "Need to see green, five-minute candle following the release to consider a long trade on USD/CAD."
- Bullish trade: "Need red, five-minute candle to favor a short USD/CAD trade."
==========
USD/CAD H1: bullish ranging for correction. The price is located above Ichimoku cloud for the ranging within the following support/resistance levels:
- 1.3083 support level located above Ichimoku cloud in the beginning of the secondary correction, and
- 1.3139 resistance level located far above Ichimoku cloud in the bullish area of the chart.
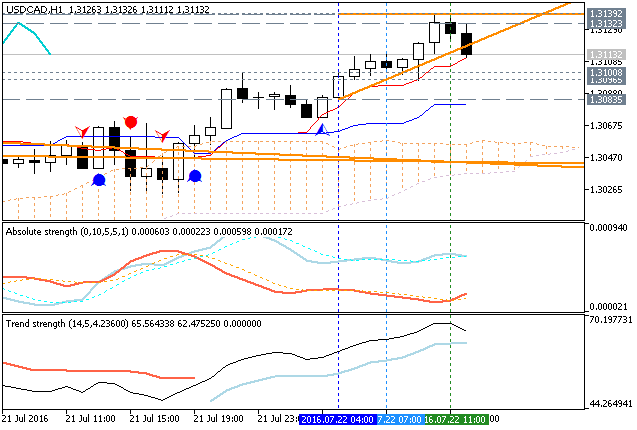
If the price breaks 1.3083 support level to below on close H1
bar so the local downtrend as the secondary correction within the primary bullish trend will be started.
If the price breaks 1.3139
resistance to above on close H1 bar so the bullish trend will be continuing.
If not so the price will be on bullish ranging within the levels.
| Resistance | Support |
|---|---|
| 1.3139 | 1.3083 |
| N/A | 1.3023 |
USD/CAD M5: 37 pips range price movement by Canada Consumer Price Index news event
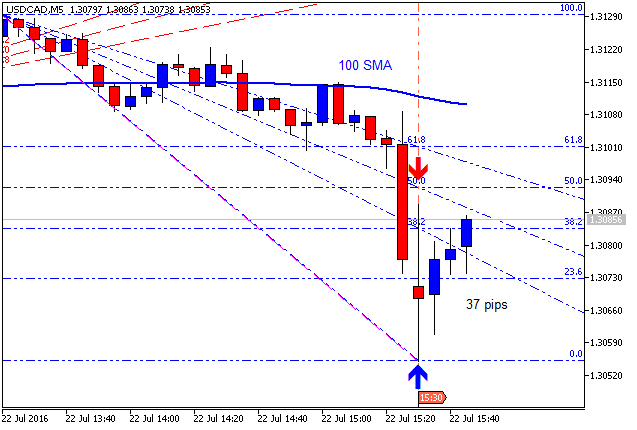
As we are going to have Canada's Gross Domestic Product news event tomorrow so this is some daily situation for this pair for now.
USD/CAD D1. Bullish ranging within key 'reversal' levels. The price is on ranging within the following s/r levels:
- 1.3251 resistance located far from Ichimoku cloud in the bullish area of the chart, and
- 1.2926 support level located in the beginning of the bearish trend to be started.
Absolute Strength indicator is estimating the trend as the ranging bullish in the near future.
If D1 price breaks 1.2926
support level on close bar so the bearish reversal will be started.
If D1 price breaks 1.3251
resistance level on close bar from below to above so the primary bullish trend will be resumed.
If not so the price will be on ranging within the levels.

- Recommendation for long: watch close D1 price to break 1.3251 for possible buy trade
- Recommendation
to go short: watch D1 price to break 1.2926 support level for possible sell trade
- Trading Summary: ranging
| Resistance | Support |
|---|---|
| 1.3251 | 1.2926 |
| N/A | 1.2677 |
SUMMARY : bullish
TREND : ranging
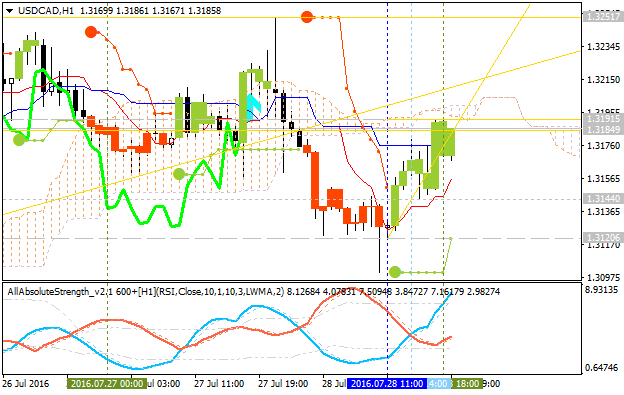
And this is very interesting situation in intra-day H1 chart: the price is on local uptrend as the bear market rally - price is testing 1.3191 resistance level to above for the bullish reversal. Alternative, if the price breaks 1.3120 support level to below so the primary bearish trend will be continuing, otherwise - ranging.
- Free trading apps
- Over 8,000 signals for copying
- Economic news for exploring financial markets
You agree to website policy and terms of use

Daily price is on bullish condition to be on ranging near and above Senkou Span line which si the virtual border between the primary ebarish and the primary bullish trend on the daily chart. The price is located within the following key support/resistance levels:
Chinkou Span line is located above ther price for the bullish condition with the secondary ranging by the direction, and Absolute Strength indicator si estimating the trend to be on ranging in the near future.
If D1 price breaks 1.2836 support level on close bar so the bearish reversal will be started.If D1 price breaks 1.3139 resistance level on close bar from below to above so the primary bullish trend will be resumed.
If not so the price will be on ranging within the levels.
TREND : rangingSUMMARY : bullish ranging near bearish reversal