Press review - page 422
You are missing trading opportunities:
- Free trading apps
- Over 8,000 signals for copying
- Economic news for exploring financial markets
Registration
Log in
You agree to website policy and terms of use
If you do not have an account, please register
A lesson on what traders of the stock, futures, and forex markets look for when the Gross Domestic Product (GDP) Number is released.
As we have learned in previous lessons there are many components of the US Economy which can affect overall economic growth and inflation expectations. Some of the major examples here are how many people are employed in the economy vs. unemployed, how much the housing market is growing in different parts of the country, and at what rate the prices for different products in the economy are seeing increases.
As all of these things are so important to the economy and therefore to the markets, there are no shortage of economic reports which are released to try and help people gauge how things are going with different pieces of the economy. It is important for us as traders to understand the major reports here as even if we are trading off of technicals, understanding what is happening in the market from a fundamental standpoint can help establish a longer term bias for trading. In the short term an understanding of these numbers will also help to assess the erratic and sometimes extreme movements which can occur after economic releases.
The granddaddy of all economic reports is the release of the Gross Domestic Product (GDP) number for the economy. The Gross Domestic Product for the US or any other country is the final value of all the goods and services produced in that economy. Essentially what you get after calculating GDP by adding up the value of all goods and services produced in the economy is a measure of the size of the overall economy. It is for this reason that market participants will watch the GDP number closely as the rate of growth in this number represents the rate of growth in the overall economy.
As a side note here, GDP also allows a comparison to be made of the sizes of different economies from around the world, as well as their growth rates. To give you an idea of just how large the US Economy is, 2007 GDP for the United States was estimated at 13.7 Trillion dollars. This is in comparison to the next largest economy in the world, Japan which has a GDP of under 5 Trillion Dollars.
Quarterly estimates of GDP are released each month with Advance Estimates which are incomplete and subject to further revision being released near the end of the first month after the end of the quarter being reported. In the second month after the end of the quarter being reported preliminary numbers (which basically means more accurate than advanced) normally are released and then finally the final GDP number is released at the end of the 3rd month after the end of the quarter being reported on.
Traders are going to focus heavily on the growth rate released in the Advanced number and markets will also move on any significant revisions made in the preliminary and final GDP numbers.
In addition to looking at the growth or lack thereof in the overall GDP number, traders will also look at the growth or lack there of in the different components that make up the number. As GDP represents the value of everything in an Economy you can imagine the amount of data that goes into compiling the number, much of which is published for market participants to view. By looking at the different pieces which make up GDP we can get a good picture of what is happening not only with the overall economy but with all the different components of the economy which are reported on to come up with the final number. .
Now we could spend many lessons going over all the data that is in this report. The goal here however is to build a framework for understanding the major components so we as traders can understand what is going on when the market reacts to certain pieces of the report and will recognize when to dig deeper for more information on what is happening in a certain sector. The broad categories that it is important to have an understanding of are:
1. Personal Consumption Expenditures -- as over 65% of the US economy is made up of this category, what the individual consumer is doing ie the growth or lack thereof in their consumption, as well as on what goods and services they are spending their money on is heavily focused on.
2. Private Investment - This includes purchases of things such as computers, equipment and inventories (known as fixed assets) by businesses, purchases of homes by individuals, and of businesses investing in inventories of goods to sell. These are all obviously important things, as how much businesses are investing is a good indication of how they feel about future growth prospects, and how much growth the housing market is experiencing is also an important component of the economy.
3. Government Spending -- this includes pretty much everything the government spends money on besides social programs.
4. Exports -- Imports -- an important number which shows how wide the gap is between how much the country exports and how much it imports.
What the GDP number is going to give you a feel for is how much each of the above grew for the quarter and what their overall contribution to the economy was. The above numbers will then be broken down into more detailed numbers which go into compiling the final number for the above 4 categories.
2016-07-29 12:30 GMT | [USD - GDP]
if actual > forecast (or previous one) = good for currency (for USD in our case)
[USD - GDP] = Annualized change in the inflation-adjusted value of all goods and services produced by the economy.
==========
==========
EUR/USD M5: 31 pips range price movement by U.S. Gross Domestic Product news event
==========
Dollar Index M5: intra-day bearish breakdown by U.S. Gross Domestic Product news event
Weekly Outlook: 2016, July 31 - August 07 (based on the article)
US ISM Manufacturing PMI, ISM Non-Manufacturing PMI, Crude Oil Inventories, Australian and UK rate decision, Canadian and US employment data including the major US monthly employment report. These are the highlights of this week.
EUR/USD Intra-Day Fundamentals: Manufacturing ISM Report On Business and 7 pips range price movement
2016-08-01 14:00 GMT | [USD - ISM Manufacturing PMI]
if actual > forecast (or previous one) = good for currency (for GBP in our case)
[USD - ISM Manufacturing PMI] = Level of a diffusion index based on surveyed purchasing managers in the manufacturing industry.
==========
"The report was issued today by Bradley J. Holcomb, CPSM, CPSD, chair of the Institute for Supply Management® (ISM®) Manufacturing Business Survey Committee. "The July PMI® registered 52.6 percent, a decrease of 0.6 percentage point from the June reading of 53.2 percent. The New Orders Index registered 56.9 percent, a decrease of 0.1 percentage point from the June reading of 57 percent. The Production Index registered 55.4 percent, 0.7 percentage point higher than the June reading of 54.7 percent. The Employment Index registered 49.4 percent, a decrease of 1 percentage point from the June reading of 50.4 percent. Inventories of raw materials registered 49.5 percent, an increase of 1 percentage point from the June reading of 48.5 percent."==========
EUR/USD M5: 7 pips range price movement by ISM Manufacturing PMI news event
S&P 500 August 2016 Forecast: high volatility to be expected (adapted from the article)
Weekly price is located above Ichimoku cloud for the bullish market consdition with 2177.00 resistance level to be testing for the bullish trend to be continuing. The bearish reversal level is 1981.25, and if the price breaks this support level to below so the medium term bearish reversal will be started. Thus, the price is located within 2177/1981 ranging area with high volatility to be expected in August for example.
If W1 price breaks 1981.25 support level on close weekly bar so the primary bearish reversal will be started.
If W1 price breaks 2177.00 resistance level to above so the primary bullish trend will be continuing.
If not so the price will be on bullish ranging within 2177/1981 levels
Trend: bullish
Forum on trading, automated trading systems and testing trading strategies
Gold Prices Score 3-Week High on Monday; Silver Eyes 2-year High
George Georgoudakis, 2016.08.02 01:32
Gold prices ended the U.S. day session modestly higher Monday and closed at a three-week high. There was decent follow-through buying from Friday’s gains says Peter Hug, global trading director for Kitco Metals. 'Gold is digesting last week’s sprint higher and traded in an extremely tight range overnight. The GDP data from Friday should continue to provide underlying support for gold, but Fed speak remains the obstacle to a clear path higher,' he told Kitco News on Monday. December Comex gold futures settled the day at $1,359.60 an ounce. 'New York Fed President William Dudley has voiced concerns over the risks to further growth and suggests that the Fed may likely wait until December before any rate hike. Turn the channel and you find Federal Reserve Bank of Dallas Fed President Robert Kaplan arguing that a September increase remains on the table. Understanding the need to remain polite, I cannot put into words my amazement with the Fed’s communication prowess,' Hug said. The veteran trader noted that he remains constructive but needs the $1,355 gold level to be taken out.
AUD/USD Intra-Day Fundamentals: RBA Cash Rate and 59 pips range price movement
2016-08-02 04:30 GMT | [AUD - RBA Cash Rate]
if actual > forecast (or previous one) = good for currency (for AUD in our case)
[AUD - RBA Cash Rate] = Interest rate charged on overnight loans between financial intermediaries.
==========
From news.com.au article:
==========
AUD/USD M5: 59 pips range price movement by RBA Cash Rate news event
GBP/USD Intra-Day Fundamentals: U.K. Construction PMI and 57 pips range price movement
2016-08-02 08:30 GMT | [GBP - Construction PMI]
if actual > forecast (or previous one) = good for currency (for GBP in our case)
[GBP - Construction PMI] = Level of a diffusion index based on surveyed purchasing managers in the construction industry.
==========
"The seasonally adjusted Markit/CIPS UK Construction Purchasing Managers’ Index® (PMI®) registered 45.9 in July, down fractionally from 46.0 in June and below the 50.0 no-change threshold for the second month running. The latest reading signalled the fastest overall decline in construction output since June 2009. This largely reflected the steepest fall in commercial building for over six-and-a-half years, alongside a drop in civil engineering activity for for the first time in 2016. Residential construction also declined at a solid pace in July, but the rate of contraction eased from June’s three-and-a-half year low."==========
GBP/USD M5: 59 pips range price movement by U.K. Construction PMI news event
Forum on trading, automated trading systems and testing trading strategies
Indicators: Fibonacci retracement
Sergey Golubev, 2013.11.21 12:06
Fibonacci Retracements (based on stockcharts article)
Introduction
Fibonacci Retracements are ratios used to identify potential reversal levels. These ratios are found in the Fibonacci sequence. The most popular Fibonacci Retracements are 61.8% and 38.2%. Note that 38.2% is often rounded to 38% and 61.8 is rounded to 62%. After an advance, chartists apply Fibonacci ratios to define retracement levels and forecast the extent of a correction or pullback. Fibonacci Retracements can also be applied after a decline to forecast the length of a counter trend bounce. These retracements can be combined with other indicators and price patterns to create an overall strategy.
The Sequence and RatiosThis article is not designed to delve too deep into the mathematical properties behind the Fibonacci sequence and Golden Ratio. There are plenty of other sources for this detail. A few basics, however, will provide the necessary background for the most popular numbers. Leonardo Pisano Bogollo (1170-1250), an Italian mathematician from Pisa, is credited with introducing the Fibonacci sequence to the West. It is as follows:
0, 1, 1, 2, 3, 5, 8, 13, 21, 34, 55, 89, 144, 233, 377, 610……
The sequence extends to infinity and contains many unique mathematical properties.
1.618 refers to the Golden Ratio or Golden Mean, also called Phi. The inverse of 1.618 is .618. These ratios can be found throughout nature, architecture, art and biology. In his book, Elliott Wave Principle, Robert Prechter quotes William Hoffer from the December 1975 issue of Smithsonian Magazine:
….the proportion of .618034 to 1 is the mathematical basis for the shape of playing cards and the Parthenon, sunflowers and snail shells, Greek vases and the spiral galaxies of outer space. The Greeks based much of their art and architecture upon this proportion. They called it the golden mean.
Alert ZonesRetracement levels alert traders or investors of a potential trend reversal, resistance area or support area. Retracements are based on the prior move. A bounce is expected to retrace a portion of the prior decline, while a correction is expected to retrace a portion of the prior advance. Once a pullback starts, chartists can identify specific Fibonacci retracement levels for monitoring. As the correction approaches these retracements, chartists should become more alert for a potential bullish reversal. Chart 1 shows Home Depot retracing around 50% of its prior advance.
The inverse applies to a bounce or corrective advance after a decline. Once a bounce begins, chartists can identify specific Fibonacci retracement levels for monitoring. As the correction approaches these retracements, chartists should become more alert for a potential bearish reversal. Chart 2 shows 3M (MMM) retracing around 50% of its prior decline.
Keep in mind that these retracement levels are not hard reversal points. Instead, they serve as alert zones for a potential reversal. It is at this point that traders should employ other aspects of technical analysis to identify or confirm a reversal. These may include candlesticks, price patterns, momentum oscillators or moving averages.
Common RetracementsThe Fibonacci Retracements Tool at StockCharts shows four common retracements: 23.6%, 38.2%, 50% and 61.8%. From the Fibonacci section above, it is clear that 23.6%, 38.2% and 61.8% stem from ratios found within the Fibonacci sequence. The 50% retracement is not based on a Fibonacci number. Instead, this number stems from Dow Theory's assertion that the Averages often retrace half their prior move.
Based on depth, we can consider a 23.6% retracement to be relatively shallow. Such retracements would be appropriate for flags or short pullbacks. Retracements in the 38.2%-50% range would be considered moderate. Even though deeper, the 61.8% retracement can be referred to as the golden retracement. It is, after all, based on the Golden Ratio.
Shallow retracements occur, but catching these requires a closer watch and quicker trigger finger. The examples below use daily charts covering 3-9 months. Focus will be on moderate retracements (38.2-50%) and golden retracements (61.8%). In addition, these examples will show how to combine retracements with other indicators to confirm a reversal.
Moderate RetracementsChart 3 shows Target (TGT) with a correction that retraced 38% of the prior advance. This decline also formed a falling wedge, which is typical for corrective moves. The combination raised the reversal alert. Chaikin Money Flow turned positive as the stock surged in late June, but this first reversal attempt failed. Yes, there will be failures. The second reversal in mid July was successful. Notice that TGT gapped up, broke the wedge trend line and Chaikin Money Flow turned positive (green line).
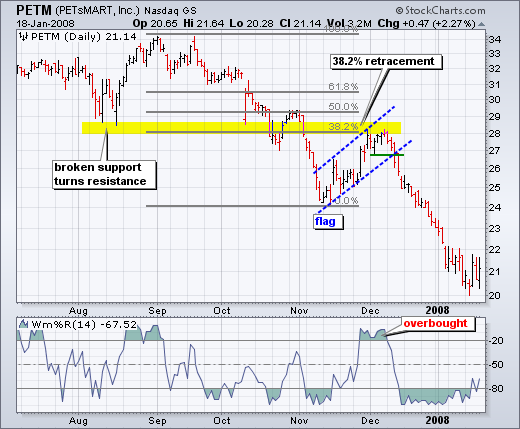
Chart 4 shows Petsmart (PETM) with a moderate 38% retracement and other signals coming together. After declining in September-October, the stock bounced back to around 28 in November. In addition to the 38% retracement, notice that broken support turned into resistance in this area. The combination served as an alert for a potential reversal. William %R was trading above -20% and overbought as well. Subsequent signals affirmed the reversal. First, Williams %R moved back below -20%. Second, PETM formed a rising flag and broke flag support with a sharp decline the second week of December.
Golden RetracementsChart 4 shows Pfizer (PFE) bottoming near the 62% retracement level. Prior to this successful bounce, there was a failed bounce near the 50% retracement. The successful reversal occurred with a hammer on high volume and follow through with a breakout a few days later.
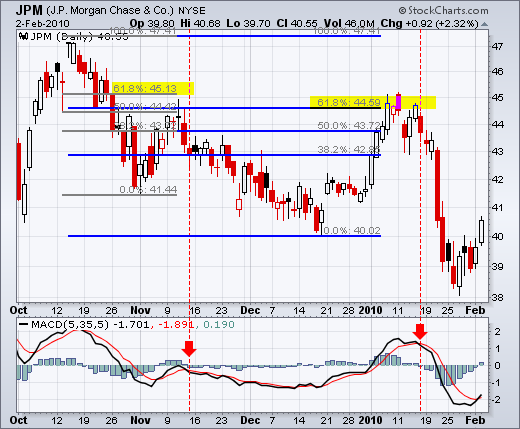
Chart 5 shows JP Morgan (JPM) topping near the 62% retracement level. The surge to the 62% retracement was quite strong, but resistance suddenly appeared with a reversal confirmation coming from MACD (5,35,5). The red candlestick and gap down affirmed resistance near the 62% retracement. There was a two day bounce back above 44.5, but this bounce quickly failed as MACD moved below its signal line (red dotted line).
ConclusionsFibonacci retracements are often used to identify the end of a correction or a counter-trend bounce. Corrections and counter-trend bounces often retrace a portion of the prior move. While short 23.6% retracements do occur, the 38.2-61.8% covers the more possibilities (with 50% in the middle). This zone may seem big, but it is just a reversal alert zone. Other technical signals are needed to confirm a reversal. Reversals can be confirmed with candlesticks, momentum indicators, volume or chart patterns. In fact, the more confirming factors the more robust the signal.