Join our fan page

NirvamanImax - expert for MetaTrader 4

- Views:
- 20767
- Rating:
- Published:
- Updated:
-
 You are missing trading opportunities:
- Free trading apps
- Over 8,000 signals for copying
- Economic news for exploring financial markets
Registration Log inYou agree to website policy and terms of use
If you do not have an account, please register -
 Need a robot or indicator based on this code? Order it on Freelance
Go to Freelance
Need a robot or indicator based on this code? Order it on Freelance
Go to Freelance
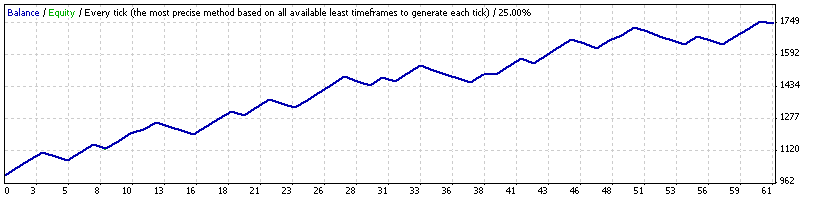
Strategy Tester Report
| Symbol | EURUSD (Euro vs. United States Dollar) | ||||
| Period | 1 Minute (M1) 2009.06.15 00:00 - 2009.06.19 23:00 (2009.06.14 - 2009.06.20) | ||||
| Model | Every tick (the most precise method based on all available least timeframes) | ||||
| Parameters | lots=0.1; mn=555; tp=40; sl=18; periodos=3; tiempoCierre=24900; | ||||
| Bars in test | 7855 | Ticks modelled | 73060 | Modelling quality | 25.00% |
| Mismatched charts errors | 0 | ||||
| Initial deposit | 1000.00 | ||||
| Total net profit | 745.12 | Gross profit | 1257.12 | Gross loss | -512.00 |
| Profit factor | 2.46 | Expected payoff | 12.22 | ||
| Absolute drawdown | 15.00 | Maximal drawdown | 99.00 (6.36%) | Relative drawdown | 6.40% (81.00) |
| Total trades | 61 | Short positions (won %) | 30 (60.00%) | Long positions (won %) | 31 (54.84%) |
| Profit trades (% of total) | 35 (57.38%) | Loss trades (% of total) | 26 (42.62%) | ||
| Largest | profit trade | 38.00 | loss trade | -20.00 | |
| Average | profit trade | 35.92 | loss trade | -19.69 | |
| Maximum | consecutive wins (profit in money) | 4 (151.78) | consecutive losses (loss in money) | 4 (-80.00) | |
| Maximal | consecutive profit (count of wins) | 151.78 (4) | consecutive loss (count of losses) | -80.00 (4) | |
| Average | consecutive wins | 3 | consecutive losses | 2 | |
| # | Time | Type | Order | Size | Price | S / L | T / P | Profit | Balance |
| 1 | 2009.06.15 00:17 | sell | 1 | 0.10 | 1.3989 | 1.4009 | 1.3951 | ||
| 2 | 2009.06.15 06:35 | t/p | 1 | 0.10 | 1.3951 | 1.4009 | 1.3951 | 38.00 | 1038.00 |
| 3 | 2009.06.15 07:07 | sell | 2 | 0.10 | 1.3955 | 1.3975 | 1.3917 | ||
| 4 | 2009.06.15 08:52 | t/p | 2 | 0.10 | 1.3917 | 1.3975 | 1.3917 | 38.00 | 1076.00 |
| 5 | 2009.06.15 09:06 | sell | 3 | 0.10 | 1.3906 | 1.3926 | 1.3868 | ||
| 6 | 2009.06.15 10:47 | t/p | 3 | 0.10 | 1.3868 | 1.3926 | 1.3868 | 38.00 | 1114.00 |
| 7 | 2009.06.15 11:00 | sell | 4 | 0.10 | 1.3870 | 1.3890 | 1.3832 | ||
| 8 | 2009.06.15 11:17 | s/l | 4 | 0.10 | 1.3890 | 1.3890 | 1.3832 | -20.00 | 1094.00 |
| 9 | 2009.06.15 11:22 | buy | 5 | 0.10 | 1.3889 | 1.3869 | 1.3927 | ||
| 10 | 2009.06.15 11:31 | s/l | 5 | 0.10 | 1.3869 | 1.3869 | 1.3927 | -20.00 | 1074.00 |
| 11 | 2009.06.15 11:46 | sell | 6 | 0.10 | 1.3881 | 1.3901 | 1.3843 | ||
| 12 | 2009.06.15 14:05 | t/p | 6 | 0.10 | 1.3843 | 1.3901 | 1.3843 | 38.00 | 1112.00 |
| 13 | 2009.06.15 14:09 | buy | 7 | 0.10 | 1.3844 | 1.3824 | 1.3882 | ||
| 14 | 2009.06.15 15:57 | t/p | 7 | 0.10 | 1.3882 | 1.3824 | 1.3882 | 38.00 | 1150.00 |
| 15 | 2009.06.15 16:13 | buy | 8 | 0.10 | 1.3875 | 1.3855 | 1.3913 | ||
| 16 | 2009.06.15 16:35 | s/l | 8 | 0.10 | 1.3855 | 1.3855 | 1.3913 | -20.00 | 1130.00 |
| 17 | 2009.06.15 16:42 | sell | 9 | 0.10 | 1.3848 | 1.3868 | 1.3810 | ||
| 18 | 2009.06.15 18:00 | t/p | 9 | 0.10 | 1.3810 | 1.3868 | 1.3810 | 38.00 | 1168.00 |
| 19 | 2009.06.15 18:20 | sell | 10 | 0.10 | 1.3798 | 1.3818 | 1.3760 | ||
| 20 | 2009.06.15 19:29 | t/p | 10 | 0.10 | 1.3760 | 1.3818 | 1.3760 | 38.00 | 1206.00 |
| 21 | 2009.06.15 19:32 | buy | 11 | 0.10 | 1.3773 | 1.3753 | 1.3811 | ||
| 22 | 2009.06.16 02:27 | close | 11 | 0.10 | 1.3791 | 1.3753 | 1.3811 | 18.00 | 1224.00 |
| 23 | 2009.06.16 02:43 | sell | 12 | 0.10 | 1.3788 | 1.3808 | 1.3750 | ||
| 24 | 2009.06.16 03:29 | t/p | 12 | 0.10 | 1.3750 | 1.3808 | 1.3750 | 38.00 | 1262.00 |
| 25 | 2009.06.16 03:57 | sell | 13 | 0.10 | 1.3765 | 1.3785 | 1.3727 | ||
| 26 | 2009.06.16 04:48 | s/l | 13 | 0.10 | 1.3785 | 1.3785 | 1.3727 | -20.00 | 1242.00 |
| 27 | 2009.06.16 05:23 | sell | 14 | 0.10 | 1.3809 | 1.3829 | 1.3771 | ||
| 28 | 2009.06.16 08:21 | s/l | 14 | 0.10 | 1.3829 | 1.3829 | 1.3771 | -20.00 | 1222.00 |
| 29 | 2009.06.16 08:28 | buy | 15 | 0.10 | 1.3840 | 1.3820 | 1.3878 | ||
| 30 | 2009.06.16 08:38 | s/l | 15 | 0.10 | 1.3820 | 1.3820 | 1.3878 | -20.00 | 1202.00 |
| 31 | 2009.06.16 08:42 | buy | 16 | 0.10 | 1.3826 | 1.3806 | 1.3864 | ||
| 32 | 2009.06.16 10:20 | t/p | 16 | 0.10 | 1.3864 | 1.3806 | 1.3864 | 38.00 | 1240.00 |
| 33 | 2009.06.16 11:08 | buy | 17 | 0.10 | 1.3857 | 1.3837 | 1.3895 | ||
| 34 | 2009.06.16 12:00 | t/p | 17 | 0.10 | 1.3895 | 1.3837 | 1.3895 | 38.00 | 1278.00 |
| 35 | 2009.06.16 12:06 | sell | 18 | 0.10 | 1.3908 | 1.3928 | 1.3870 | ||
| 36 | 2009.06.16 13:16 | t/p | 18 | 0.10 | 1.3870 | 1.3928 | 1.3870 | 38.00 | 1316.00 |
| 37 | 2009.06.16 13:51 | sell | 19 | 0.10 | 1.3887 | 1.3907 | 1.3849 | ||
| 38 | 2009.06.16 14:11 | s/l | 19 | 0.10 | 1.3907 | 1.3907 | 1.3849 | -20.00 | 1296.00 |
| 39 | 2009.06.16 14:25 | buy | 20 | 0.10 | 1.3894 | 1.3874 | 1.3932 | ||
| 40 | 2009.06.16 15:31 | t/p | 20 | 0.10 | 1.3932 | 1.3874 | 1.3932 | 38.00 | 1334.00 |
| 41 | 2009.06.16 15:35 | sell | 21 | 0.10 | 1.3910 | 1.3930 | 1.3872 | ||
| 42 | 2009.06.16 16:26 | t/p | 21 | 0.10 | 1.3872 | 1.3930 | 1.3872 | 38.00 | 1372.00 |
| 43 | 2009.06.16 16:31 | buy | 22 | 0.10 | 1.3877 | 1.3857 | 1.3915 | ||
| 44 | 2009.06.16 16:57 | s/l | 22 | 0.10 | 1.3857 | 1.3857 | 1.3915 | -20.00 | 1352.00 |
| 45 | 2009.06.16 17:08 | sell | 23 | 0.10 | 1.3868 | 1.3888 | 1.3830 | ||
| 46 | 2009.06.16 17:38 | s/l | 23 | 0.10 | 1.3888 | 1.3888 | 1.3830 | -20.00 | 1332.00 |
| 47 | 2009.06.16 18:19 | sell | 24 | 0.10 | 1.3907 | 1.3927 | 1.3869 | ||
| 48 | 2009.06.16 19:33 | t/p | 24 | 0.10 | 1.3869 | 1.3927 | 1.3869 | 38.00 | 1370.00 |
| 49 | 2009.06.16 19:47 | sell | 25 | 0.10 | 1.3858 | 1.3878 | 1.3820 | ||
| 50 | 2009.06.17 02:09 | t/p | 25 | 0.10 | 1.3820 | 1.3878 | 1.3820 | 37.78 | 1407.78 |
| 51 | 2009.06.17 02:28 | buy | 26 | 0.10 | 1.3820 | 1.3800 | 1.3858 | ||
| 52 | 2009.06.17 06:44 | t/p | 26 | 0.10 | 1.3858 | 1.3800 | 1.3858 | 38.00 | 1445.78 |
| 53 | 2009.06.17 06:53 | buy | 27 | 0.10 | 1.3870 | 1.3850 | 1.3908 | ||
| 54 | 2009.06.17 09:27 | t/p | 27 | 0.10 | 1.3908 | 1.3850 | 1.3908 | 38.00 | 1483.78 |
| 55 | 2009.06.17 09:35 | buy | 28 | 0.10 | 1.3914 | 1.3894 | 1.3952 | ||
| 56 | 2009.06.17 10:13 | s/l | 28 | 0.10 | 1.3894 | 1.3894 | 1.3952 | -20.00 | 1463.78 |
| 57 | 2009.06.17 10:25 | sell | 29 | 0.10 | 1.3900 | 1.3920 | 1.3862 | ||
| 58 | 2009.06.17 10:46 | s/l | 29 | 0.10 | 1.3920 | 1.3920 | 1.3862 | -20.00 | 1443.78 |
| 59 | 2009.06.17 10:50 | sell | 30 | 0.10 | 1.3908 | 1.3928 | 1.3870 | ||
| 60 | 2009.06.17 11:41 | t/p | 30 | 0.10 | 1.3870 | 1.3928 | 1.3870 | 38.00 | 1481.78 |
| 61 | 2009.06.17 11:45 | buy | 31 | 0.10 | 1.3878 | 1.3858 | 1.3916 | ||
| 62 | 2009.06.17 12:26 | s/l | 31 | 0.10 | 1.3858 | 1.3858 | 1.3916 | -20.00 | 1461.78 |
| 63 | 2009.06.17 12:39 | sell | 32 | 0.10 | 1.3865 | 1.3885 | 1.3827 | ||
| 64 | 2009.06.17 14:58 | t/p | 32 | 0.10 | 1.3827 | 1.3885 | 1.3827 | 38.00 | 1499.78 |
| 65 | 2009.06.17 15:01 | buy | 33 | 0.10 | 1.3836 | 1.3816 | 1.3874 | ||
| 66 | 2009.06.17 15:45 | t/p | 33 | 0.10 | 1.3874 | 1.3816 | 1.3874 | 38.00 | 1537.78 |
| 67 | 2009.06.17 16:23 | buy | 34 | 0.10 | 1.3877 | 1.3857 | 1.3915 | ||
| 68 | 2009.06.17 17:27 | s/l | 34 | 0.10 | 1.3857 | 1.3857 | 1.3915 | -20.00 | 1517.78 |
| 69 | 2009.06.17 17:45 | sell | 35 | 0.10 | 1.3850 | 1.3870 | 1.3812 | ||
| 70 | 2009.06.17 18:01 | s/l | 35 | 0.10 | 1.3870 | 1.3870 | 1.3812 | -20.00 | 1497.78 |
| 71 | 2009.06.17 18:06 | sell | 36 | 0.10 | 1.3867 | 1.3887 | 1.3829 | ||
| 72 | 2009.06.17 20:35 | s/l | 36 | 0.10 | 1.3887 | 1.3887 | 1.3829 | -20.00 | 1477.78 |
| 73 | 2009.06.17 21:26 | sell | 37 | 0.10 | 1.3963 | 1.3983 | 1.3925 | ||
| 74 | 2009.06.17 21:30 | s/l | 37 | 0.10 | 1.3983 | 1.3983 | 1.3925 | -20.00 | 1457.78 |
| 75 | 2009.06.17 21:33 | sell | 38 | 0.10 | 1.3972 | 1.3992 | 1.3934 | ||
| 76 | 2009.06.18 02:04 | t/p | 38 | 0.10 | 1.3934 | 1.3992 | 1.3934 | 37.34 | 1495.12 |
| 77 | 2009.06.18 02:07 | buy | 39 | 0.10 | 1.3937 | 1.3917 | 1.3975 | ||
| 78 | 2009.06.18 09:02 | close | 39 | 0.10 | 1.3938 | 1.3917 | 1.3975 | 1.00 | 1496.12 |
| 79 | 2009.06.18 09:03 | buy | 40 | 0.10 | 1.3944 | 1.3924 | 1.3982 | ||
| 80 | 2009.06.18 10:10 | t/p | 40 | 0.10 | 1.3982 | 1.3924 | 1.3982 | 38.00 | 1534.12 |
| 81 | 2009.06.18 10:26 | sell | 41 | 0.10 | 1.3983 | 1.4003 | 1.3945 | ||
| 82 | 2009.06.18 10:55 | t/p | 41 | 0.10 | 1.3945 | 1.4003 | 1.3945 | 38.00 | 1572.12 |
| 83 | 2009.06.18 11:10 | sell | 42 | 0.10 | 1.3936 | 1.3956 | 1.3898 | ||
| 84 | 2009.06.18 12:59 | s/l | 42 | 0.10 | 1.3956 | 1.3956 | 1.3898 | -20.00 | 1552.12 |
| 85 | 2009.06.18 13:04 | sell | 43 | 0.10 | 1.3952 | 1.3972 | 1.3914 | ||
| 86 | 2009.06.18 14:59 | t/p | 43 | 0.10 | 1.3914 | 1.3972 | 1.3914 | 38.00 | 1590.12 |
| 87 | 2009.06.18 15:02 | buy | 44 | 0.10 | 1.3922 | 1.3902 | 1.3960 | ||
| 88 | 2009.06.18 15:52 | t/p | 44 | 0.10 | 1.3960 | 1.3902 | 1.3960 | 38.00 | 1628.12 |
| 89 | 2009.06.18 15:59 | buy | 45 | 0.10 | 1.3959 | 1.3939 | 1.3997 | ||
| 90 | 2009.06.18 17:02 | t/p | 45 | 0.10 | 1.3997 | 1.3939 | 1.3997 | 38.00 | 1666.12 |
| 91 | 2009.06.18 17:10 | buy | 46 | 0.10 | 1.3988 | 1.3968 | 1.4026 | ||
| 92 | 2009.06.18 17:29 | s/l | 46 | 0.10 | 1.3968 | 1.3968 | 1.4026 | -20.00 | 1646.12 |
| 93 | 2009.06.18 18:45 | sell | 47 | 0.10 | 1.3964 | 1.3984 | 1.3926 | ||
| 94 | 2009.06.18 19:01 | s/l | 47 | 0.10 | 1.3984 | 1.3984 | 1.3926 | -20.00 | 1626.12 |
| 95 | 2009.06.18 19:31 | sell | 48 | 0.10 | 1.3974 | 1.3994 | 1.3936 | ||
| 96 | 2009.06.18 20:48 | t/p | 48 | 0.10 | 1.3936 | 1.3994 | 1.3936 | 38.00 | 1664.12 |
| 97 | 2009.06.18 21:14 | buy | 49 | 0.10 | 1.3886 | 1.3866 | 1.3924 | ||
| 98 | 2009.06.19 04:09 | close | 49 | 0.10 | 1.3909 | 1.3866 | 1.3924 | 23.00 | 1687.12 |
| 99 | 2009.06.19 05:45 | buy | 50 | 0.10 | 1.3907 | 1.3887 | 1.3945 | ||
| 100 | 2009.06.19 08:24 | t/p | 50 | 0.10 | 1.3945 | 1.3887 | 1.3945 | 38.00 | 1725.12 |
| 101 | 2009.06.19 08:35 | buy | 51 | 0.10 | 1.3945 | 1.3925 | 1.3983 | ||
| 102 | 2009.06.19 09:17 | s/l | 51 | 0.10 | 1.3925 | 1.3925 | 1.3983 | -20.00 | 1705.12 |
| 103 | 2009.06.19 09:21 | buy | 52 | 0.10 | 1.3930 | 1.3910 | 1.3968 | ||
| 104 | 2009.06.19 09:54 | s/l | 52 | 0.10 | 1.3910 | 1.3910 | 1.3968 | -20.00 | 1685.12 |
| 105 | 2009.06.19 09:56 | buy | 53 | 0.10 | 1.3919 | 1.3899 | 1.3957 | ||
| 106 | 2009.06.19 11:39 | s/l | 53 | 0.10 | 1.3899 | 1.3899 | 1.3957 | -20.00 | 1665.12 |
| 107 | 2009.06.19 11:46 | sell | 54 | 0.10 | 1.3888 | 1.3908 | 1.3850 | ||
| 108 | 2009.06.19 12:19 | s/l | 54 | 0.10 | 1.3908 | 1.3908 | 1.3850 | -20.00 | 1645.12 |
| 109 | 2009.06.19 12:19 | buy | 55 | 0.10 | 1.3908 | 1.3888 | 1.3946 | ||
| 110 | 2009.06.19 14:21 | t/p | 55 | 0.10 | 1.3946 | 1.3888 | 1.3946 | 38.00 | 1683.12 |
| 111 | 2009.06.19 14:34 | buy | 56 | 0.10 | 1.3936 | 1.3916 | 1.3974 | ||
| 112 | 2009.06.19 15:59 | s/l | 56 | 0.10 | 1.3916 | 1.3916 | 1.3974 | -20.00 | 1663.12 |
| 113 | 2009.06.19 16:02 | buy | 57 | 0.10 | 1.3925 | 1.3905 | 1.3963 | ||
| 114 | 2009.06.19 16:13 | s/l | 57 | 0.10 | 1.3905 | 1.3905 | 1.3963 | -20.00 | 1643.12 |
| 115 | 2009.06.19 16:16 | buy | 58 | 0.10 | 1.3916 | 1.3896 | 1.3954 | ||
| 116 | 2009.06.19 18:36 | t/p | 58 | 0.10 | 1.3954 | 1.3896 | 1.3954 | 38.00 | 1681.12 |
| 117 | 2009.06.19 18:46 | buy | 59 | 0.10 | 1.3971 | 1.3951 | 1.4009 | ||
| 118 | 2009.06.19 18:57 | t/p | 59 | 0.10 | 1.4009 | 1.3951 | 1.4009 | 38.00 | 1719.12 |
| 119 | 2009.06.19 19:00 | sell | 60 | 0.10 | 1.3997 | 1.4017 | 1.3959 | ||
| 120 | 2009.06.19 21:45 | t/p | 60 | 0.10 | 1.3959 | 1.4017 | 1.3959 | 38.00 | 1757.12 |
| 121 | 2009.06.19 22:12 | buy | 61 | 0.10 | 1.3957 | 1.3937 | 1.3995 | ||
| 122 | 2009.06.19 23:00 | close at stop | 61 | 0.10 | 1.3945 | 1.3937 | 1.3995 | -12.00 | 1745.12 |
//--------------------------------------------------------------------------------------------------------------------------------------------------------------------------------------------------------------------
Hi all
NirvamaiMAx works in EURUSD. I have no tested it on other currencies. Timeframe M1.
Optimization must be done all weekends with a 5 days range of data. Optimization lasts 1 WEEK.
very very basic trend following system.
no I have not tested it in a real account yet..
As allways happen with all good EAs this EA backtest is far too optimistic, but if you want to reach the rooft you have to aim the stars.
if you ever make money with
this EA please give some of your fortune to the more
needed of my country. Thats fair in exchange to what I am giving to you.
here you can do your
donations.
https://pagos.conexioncolombia.com/home.aspx
I believe in good things happen to you when you do good things to other people. (good things have happened to me the last time I did this)
just try it. ;-)
-------------------------------------------------------------------------------------------------------------------------------------------------------------------------------------------------------------------------
for you to work with this EA, first you have to undestand some things
1) forget about indicators and rules based on static values. is foolish to think that some specific numbers or set values will work forever. target and
stoplosses must always change depending on market conditions. it only can work
when you constantly optimize the EA (all weekends).
2) if you are lazy and dont optimize it ALL WEEKENDS you will lose money.
optimization is very fast.
-------------------------------------------------------------------------------------------------------------------------------------------------------------------------------------------------------------------------
here goes the .set file. open the notpad and copy and paste the following into that notepad. the save it as nirvamanImax.set
lots=0.10000000
lots,F=0
lots,1=0.10000000
lots,2=0.00000000
lots,3=0.00000000
mn=555
mn,F=0
mn,1=555
mn,2=0
mn,3=0
tp=40.00000000
tp,F=1
tp,1=0.00000000
tp,2=2.00000000
tp,3=50.00000000
sl=18.00000000
sl,F=1
sl,1=0.00000000
sl,2=2.00000000
sl,3=25.00000000
periodos=3.00000000
periodos,F=1
periodos,1=0.00000000
periodos,2=1.00000000
periodos,3=200.00000000
tiempoCierre=24900
tiempoCierre,F=1
tiempoCierre,1=0
tiempoCierre,2=300
tiempoCierre,3=28800
 wajdyss_Ichimoku_Indicator_V1
This indicator for draw an Arrows for buy & sell, it's Depends on Kijun Line in Ichimoku Indicator
 GetColorTF
The function changes colour of object. An example of realization in the indicator.
Bollinger Bands ® rev. by Jurik
Traditional Bollinger Bands ®, revisited with algorithm based on Jurik method.
Fractal Dimension Index. + Step EMA
Linear Weighted Fractal Dimension Index (ternd vs notrend filter) plus Step EMA