Watch how to download trading robots for free
Find us on Telegram!
Join our fan page
Join our fan page
You liked the script? Try it in the MetaTrader 5 terminal

Expert Advisor based on the Sidus indicator. - expert for MetaTrader 4
Iurii Tokman

|
English
Русский
Veda http://ytg.com.ua resource - the author works for automation of trade on the forex market - advisers, experts will, trading robots, indicators, trading strategies, scripts, functions and libraries.
- Views:
- 25446
- Rating:
- Published:
-
 You are missing trading opportunities:
- Free trading apps
- Over 8,000 signals for copying
- Economic news for exploring financial markets
Registration Log inYou agree to website policy and terms of use
If you do not have an account, please register -
 Need a robot or indicator based on this code? Order it on Freelance
Go to Freelance
Need a robot or indicator based on this code? Order it on Freelance
Go to Freelance
Expert Advisor based on the Sidus indicator.
Forward:
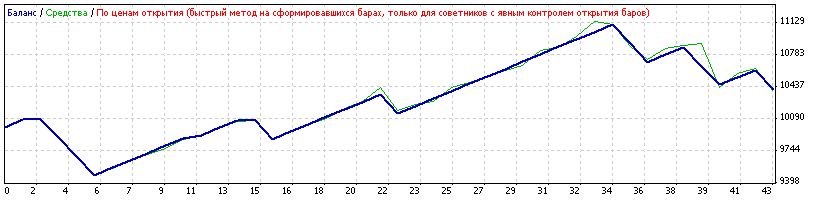
| Symbol | GBPUSD (Great Britain Pound vs US Dollar) | ||||
| Period | 1 Hour (H1) 2008.01.02 10:00 - 2009.02.15 23:59 (2008.01.01 - 2009.02.16) | ||||
| Parameters | Lots=0.1; shif=1; | ||||
| Bars in test | 7896 | Ticks modelled | 14788 | Modelling quality | n/a |
| Mismatched chart errors | 0 | ||||
| Initial deposit | 10000.00 | ||||
| Net profit | 414.37 | Gross profit | 2445.16 | Gross loss | -2030.79 |
| Profit factor | 1.20 | Expected payoff | 9.64 | ||
| Absolute drawdown | 540.03 | Maximum drawdown | 696.05 (6.26%) | Relative drawdown | 6.74% (683.82) |
| Total trades | 43 | Short positions (won %) | 25 (80.00%) | Long positions (won %) | 18 (66.67%) |
| Profit trades (% of total) | 32 (74.42%) | Loss Trades (% of total) | 11 (25.58%) | ||
| Largest | profit trade | 80.36 | loss trade | -203.30 | |
| Average | profit trade | 76.41 | loss trade | -184.62 | |
| Maximum | consecutive wins (profit in money) | 12 (960.06) | consecutive losses (loss in money) | 3 (-608.91) | |
| Maximal | consecutive profit (count of wins) | 960.06 (12) | consecutive loss (count) | -608.91 (3) | |
| Average | consecutive wins | 5 | consecutive losses | 2 | |
Optimization:
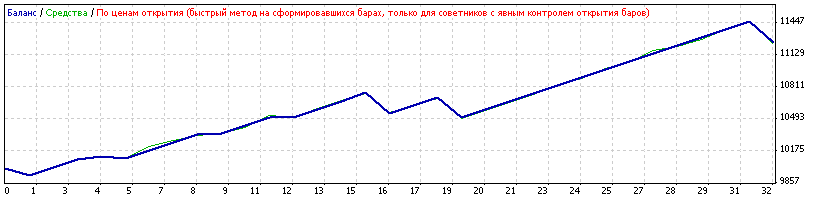
| Symbol | GBPUSD (Great Britain Pound vs US Dollar) | ||||
| Period | 1 Hour (H1) 2007.01.02 01:00 - 2007.12.28 23:59 (2007.01.01 - 2007.12.31) | ||||
| Parameters | Lots=0.1; shif=1; | ||||
| Bars in test | 7124 | Ticks modelled | 13245 | Modelling quality | n/a |
| Mismatched chart errors | 0 | ||||
| Initial deposit | 10000.00 | ||||
| Net profit | 1257.69 | Gross profit | 1960.83 | Gross loss | -703.14 |
| Profit factor | 2.79 | Expected payoff | 39.30 | ||
| Absolute drawdown | 195.21 | Maximum drawdown | 294.44 (2.73%) | Relative drawdown | 2.73% (294.44) |
| Total trades | 32 | Short positions (won %) | 12 (66.67%) | Long positions (won %) | 20 (95.00%) |
| Profit trades (% of total) | 27 (84.38%) | Loss Trades (% of total) | 5 (15.63%) | ||
| Largest | profit trade | 80.81 | loss trade | -205.10 | |
| Average | profit trade | 72.62 | loss trade | -140.63 | |
| Maximum | consecutive wins (profit in money) | 12 (958.83) | consecutive losses (loss in money) | 1 (-205.10) | |
| Maximal | consecutive profit (count of wins) | 958.83 (12) | consecutive loss (count) | -205.10 (1) | |
| Average | consecutive wins | 7 | consecutive losses | 1 | |
Translated from Russian by MetaQuotes Ltd.
Original code: https://www.mql5.com/ru/code/8715
 BW-Zone
Visualizer indicator (what a terrible phrase to use!). Colors the chart bars according to the logic of determining the state of the fourth dimension of the Chaos Theory by B. Williams - Zone.
 Tick emulation for accelerated testing of indicators ver.2
Modernization of the first version of the script with the ability to manage multiple indicators
ds_Ticks - Ticks on the price chart
Simply displays ticks on the price chart
Tick emulation for accelerated testing of indicators ver.2.2
Expansion and improvement of the script ver.2 and an example of accelerated processing of an indicator for use in conjunction with the script