Watch how to download trading robots for free
Find us on Telegram!
Join our fan page
Interesting script?
So post a link to it -
let others appraise it
You liked the script? Try it in the MetaTrader 5 terminal
Indicators

Quantora Candle Strength Analyzer MT5 - Buyer Seller Pressure and Wick Analysis - indicator for MetaTrader 5

Views:
149
Published:
MQL5 Freelance Need a robot or indicator based on this code? Order it on Freelance Go to Freelance
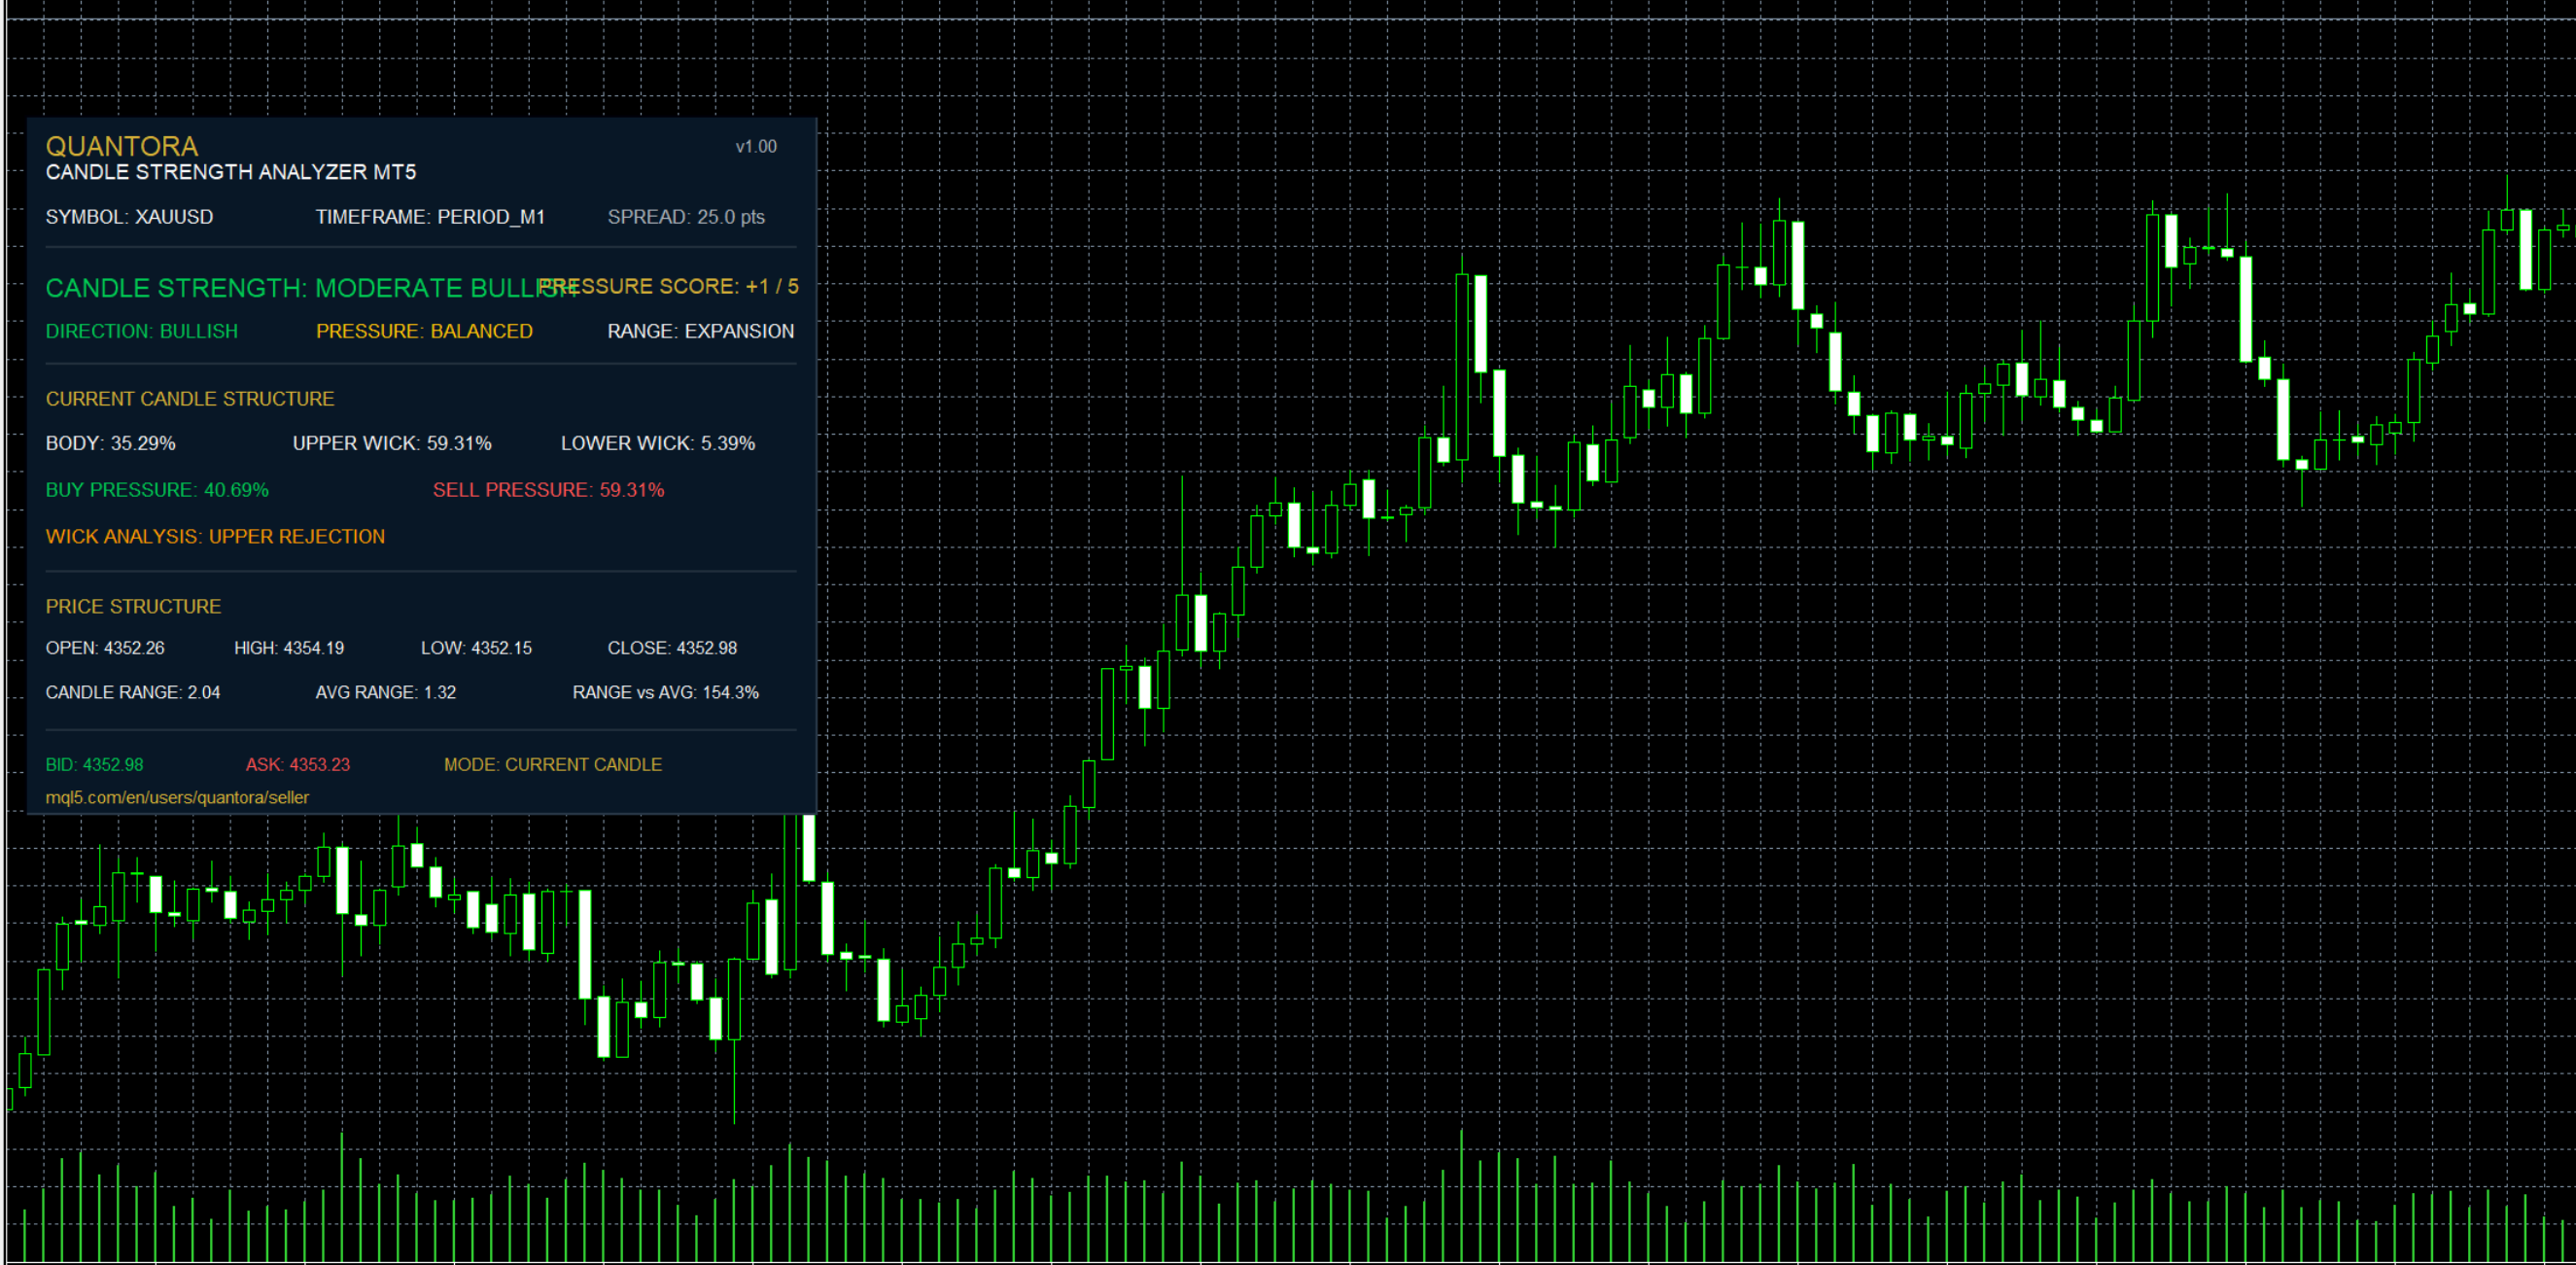

Quantora Candle Strength Analyzer MT5 is a professional price-action analysis indicator designed to evaluate the internal structure and strength of individual candles directly inside MetaTrader 5.

Instead of looking only at whether a candle is bullish or bearish, the indicator analyzes:

                                                    Candle Body %
Upper Wick %
Lower Wick %
Buyer Pressure %
Seller Pressure %
Candle Direction
Candle Strength
Wick Rejection
Range Expansion / Compression
Pressure Score

The results are displayed in a professional dashboard that provides a quick overview of the current candle's structure and market pressure.

The indicator can analyze either the currently forming candle or the last closed candle.

Main Features

  • Real-time candle analysis
  • Bullish / Bearish candle detection
  • Candle Body percentage
  • Upper Wick percentage
  • Lower Wick percentage
  • Buyer Pressure percentage
  • Seller Pressure percentage
  • Strong candle detection
  • Moderate candle detection
  • Weak / Indecision detection
  • Upper Wick Rejection detection
  • Lower Wick Rejection detection
  • Candle range analysis
  • Average range comparison
  • EXPANSION detection
  • NORMAL range detection
  • COMPRESSION detection
  • Pressure Score from -5 to +5
  • Current Candle mode
  • Closed Candle mode
  • Adjustable analysis thresholds
  • Adjustable range lookback
  • Live Bid / Ask
  • Live Spread
  • Automatic dashboard updates
  • Professional Quantora interface
  • Free and open-source MQ5 code

Candle Structure Analysis

Every candle consists of three primary components:

                                                    BODY
UPPER WICK
LOWER WICK

The indicator calculates each component as a percentage of the candle's total High-Low range.

For example:

                                                    Total Candle Range = 35 points

Body       = 24 points → 68.57%
Upper Wick = 6 points  → 17.14%
Lower Wick = 5 points  → 14.29%

This allows the candle structure to be evaluated numerically rather than visually alone.

Candle Direction

The basic candle direction is determined from Open and Close.

                                                    Close > Open
→ BULLISH

Close < Open
→ BEARISH

Close = Open
→ NEUTRAL

Direction alone, however, does not determine candle strength.

The Body percentage is also evaluated.

Candle Strength

The default Strong Body threshold is:

                                                    65%

If the candle body represents at least 65% of the entire candle range, the candle can be classified as:

                                                    STRONG BULLISH

or

STRONG BEARISH

depending on its direction.

The default Weak Body threshold is:

                                                    30%

A candle with a body percentage at or below this level is classified as:

                                                    WEAK / INDECISION

Candles between these thresholds can be classified as:

                                                    MODERATE BULLISH

or

MODERATE BEARISH

All thresholds can be customized from the indicator inputs.

Buyer / Seller Pressure

The indicator includes a simple candle-based Buyer/Seller Pressure model.

Buyer Pressure is calculated according to the location of the Close inside the candle's High-Low range:

                                                    Buyer Pressure =
(Close - Low) / (High - Low) × 100

Seller Pressure is:

                                                    Seller Pressure =
100 - Buyer Pressure

Example:

                                                    BUY PRESSURE:   74.30%
SELL PRESSURE:  25.70%

The dashboard then classifies pressure as:

                                                    BUYERS DOMINANT
SELLERS DOMINANT
BALANCED

Important

Buyer/Seller Pressure is a price-action proxy based on candle structure.

It is not exchange order flow, Level II data, bid/ask volume, footprint data or actual buyer/seller transaction volume.

This distinction is important when interpreting the indicator.

Wick Rejection Analysis

The indicator separately analyzes the upper and lower candle wicks.

Default Dominant Wick threshold:

                                                    45%

If the Upper Wick represents a sufficiently large portion of the candle range and dominates the Lower Wick:

                                                    UPPER REJECTION

is displayed.

If the Lower Wick dominates:

                                                    LOWER REJECTION

is displayed.

Otherwise:

                                                    BALANCED

is displayed.

This can help identify candles where price moved significantly away from one side of its range before closing.

Range Analysis

The indicator compares the current candle range with the average range of previous candles.

Default:

                                                    Lookback = 20 candles

The calculation is:

                                                    Range Ratio =
Current Candle Range / Average Range × 100

Example:

                                                    Average Range = 28.7 points
Current Range = 34.5 points

Range Ratio = 120.2%

Range Classification

The current version uses three range states.

EXPANSION

                                                    Range Ratio >= 150%

The current candle is significantly larger than the recent average.

NORMAL

                                                    60% < Range Ratio < 150%

The candle is within the normal recent range environment.

COMPRESSION

                                                    Range Ratio <= 60%

The current candle is significantly smaller than the recent average.

This provides additional context for interpreting candle strength.

Pressure Score

Quantora Candle Strength Analyzer combines several candle characteristics into a numerical Pressure Score.

Score range:

                                                    -5 → Strong Seller Pressure

 0 → Balanced

+5 → Strong Buyer Pressure

The model considers:

                                                    Candle Direction
Candle Strength
Buyer / Seller Pressure
Wick Rejection

Example:

                                                    CANDLE DIRECTION:
BULLISH

CANDLE STRENGTH:
STRONG BULLISH

PRESSURE:
BUYERS DOMINANT

WICK:
LOWER REJECTION

PRESSURE SCORE:
+5 / 5

A negative score represents bearish/seller-oriented candle characteristics.

A positive score represents bullish/buyer-oriented candle characteristics.

Current Candle / Closed Candle Mode

The indicator supports two analysis modes.

Current Candle

                                                    Use Current Candle = true

The currently forming candle is analyzed.

Values can change continuously until the candle closes.

Closed Candle

                                                    Use Current Candle = false

The most recently completed candle is analyzed.

This provides stable values that no longer change after candle close.

Example Dashboard

                                                    QUANTORA
CANDLE STRENGTH ANALYZER MT5
────────────────────────────────────

SYMBOL: EURUSD
TIMEFRAME: M15
SPREAD: 1.5 pts

CANDLE STRENGTH:
STRONG BULLISH

PRESSURE SCORE:
+4 / 5

DIRECTION:
BULLISH

PRESSURE:
BUYERS DOMINANT

RANGE:
EXPANSION

CURRENT CANDLE STRUCTURE

BODY:        72.60%
UPPER WICK:  15.60%
LOWER WICK:  11.80%

BUY PRESSURE:   74.30%
SELL PRESSURE:  25.70%

WICK ANALYSIS:
BALANCED

OPEN:   1.08710
HIGH:   1.08985
LOW:    1.08640
CLOSE:  1.08920

CANDLE RANGE: 0.00345
AVG RANGE:    0.00287
RANGE vs AVG: 120.2%

MODE:
CURRENT CANDLE

Adjustable Parameters

Default settings:

                                                    Lookback Bars        = 20
Strong Body Percent  = 65
Weak Body Percent    = 30
Dominant Wick Ratio  = 45
Use Current Candle   = true
Update Interval      = 2 seconds

These parameters can be customized according to the user's analysis methodology.

Supported Timeframes

The indicator operates on the timeframe of the chart where it is attached.

For example:

                                                    M1
M5
M15
M30
H1
H4
D1

Changing the chart timeframe automatically changes the candle data being analyzed.

Supported Markets

Quantora Candle Strength Analyzer can be used on broker-supported MetaTrader 5 instruments, including:

  • Forex
  • Gold and other metals
  • Indices
  • Commodities
  • Crypto CFDs
  • Other supported symbols

Because the analysis is based primarily on OHLC candle structure, it can be applied to many different markets and timeframes.

Installation

Place:

Quantora Candle Strength Analyzer MT5.mq5

inside:

MQL5 → Indicators

Open the file with MetaEditor and compile it.

Then attach Quantora Candle Strength Analyzer MT5 to the desired MetaTrader 5 chart.

The dashboard will begin analyzing candle structure automatically.

Important Notes

The indicator is designed as a price-action analysis and monitoring tool.

Buyer/Seller Pressure represents the location of the candle Close within its High-Low range and should not be interpreted as actual order-flow volume.

When Current Candle mode is enabled, all values can change until the candle closes.

Strong Bullish, Strong Bearish, Buyer Dominant, Seller Dominant, Wick Rejection and Pressure Score classifications are analytical outputs based on the mathematical rules described above.

The indicator does not:

  • Open trades
  • Close trades
  • Modify positions
  • Set Stop Loss
  • Set Take Profit
  • Guarantee market direction
  • Provide guaranteed BUY or SELL signals

Product Information

Version: 1.00
Platform: MetaTrader 5
Program Type: Indicator
Category: Indicators / Price Action Analysis
License: Free / Open Source

Developed by QUANTORA

Professional MetaTrader 5 Trading Tools, Indicators and Expert Advisors.

More Professional Quantora Trading Products

Explore Quantora's professional MetaTrader 5 Expert Advisors, premium indicators and trading tools on the official MQL5 Market:

View All Quantora Products on MQL5 Market →

Quantora Moving Average Dashboard MT5 - Professional EMA SMA Trend Analysis Quantora Moving Average Dashboard MT5 - Professional EMA SMA Trend Analysis

Professional open-source Moving Average Dashboard for MetaTrader 5. Monitors EMA 20, EMA 50, EMA 100, EMA 200, SMA 50 and SMA 200 with price position, trend structure, MA Score and overall market bias.

Quantora Multi-Timeframe MACD Dashboard MT5 - Professional MACD Momentum Analysis Quantora Multi-Timeframe MACD Dashboard MT5 - Professional MACD Momentum Analysis

Professional open-source Multi-Timeframe MACD Dashboard for MetaTrader 5. Analyzes MACD Main, Signal and Histogram across M1, M5, M15, M30, H1, H4 and D1 with an overall momentum score and market bias.

Trade Adjustment Panel Trade Adjustment Panel

On-chart trade management utility for MetaTrader 5 designed exclusively to adjust existing manual or EA positions. Features one-click controls for Break-Even placement, point offsets, profit locking, trailing stops, Risk-to-Reward (1R–3R) Take Profit targets, and volume-validated partial closures (25%–100%). Includes a draggable chart GUI and filtering by symbol and direction. Does not open new trades.

Previous Day High Low Open Close Indicator Previous Day High Low Open Close Indicator

Plots the previous trading day's High, Low and Close as horizontal reference levels across the current session, with optional multi-day history for context. No repainting, no discretion — the levels are read directly from the completed Daily bar