Join our fan page
Quantora Multi-Timeframe MACD Dashboard MT5 - Professional MACD Momentum Analysis - indicator for MetaTrader 5
- Views:
- 88
- Published:
-
Need a robot or indicator based on this code? Order it on Freelance Go to Freelance
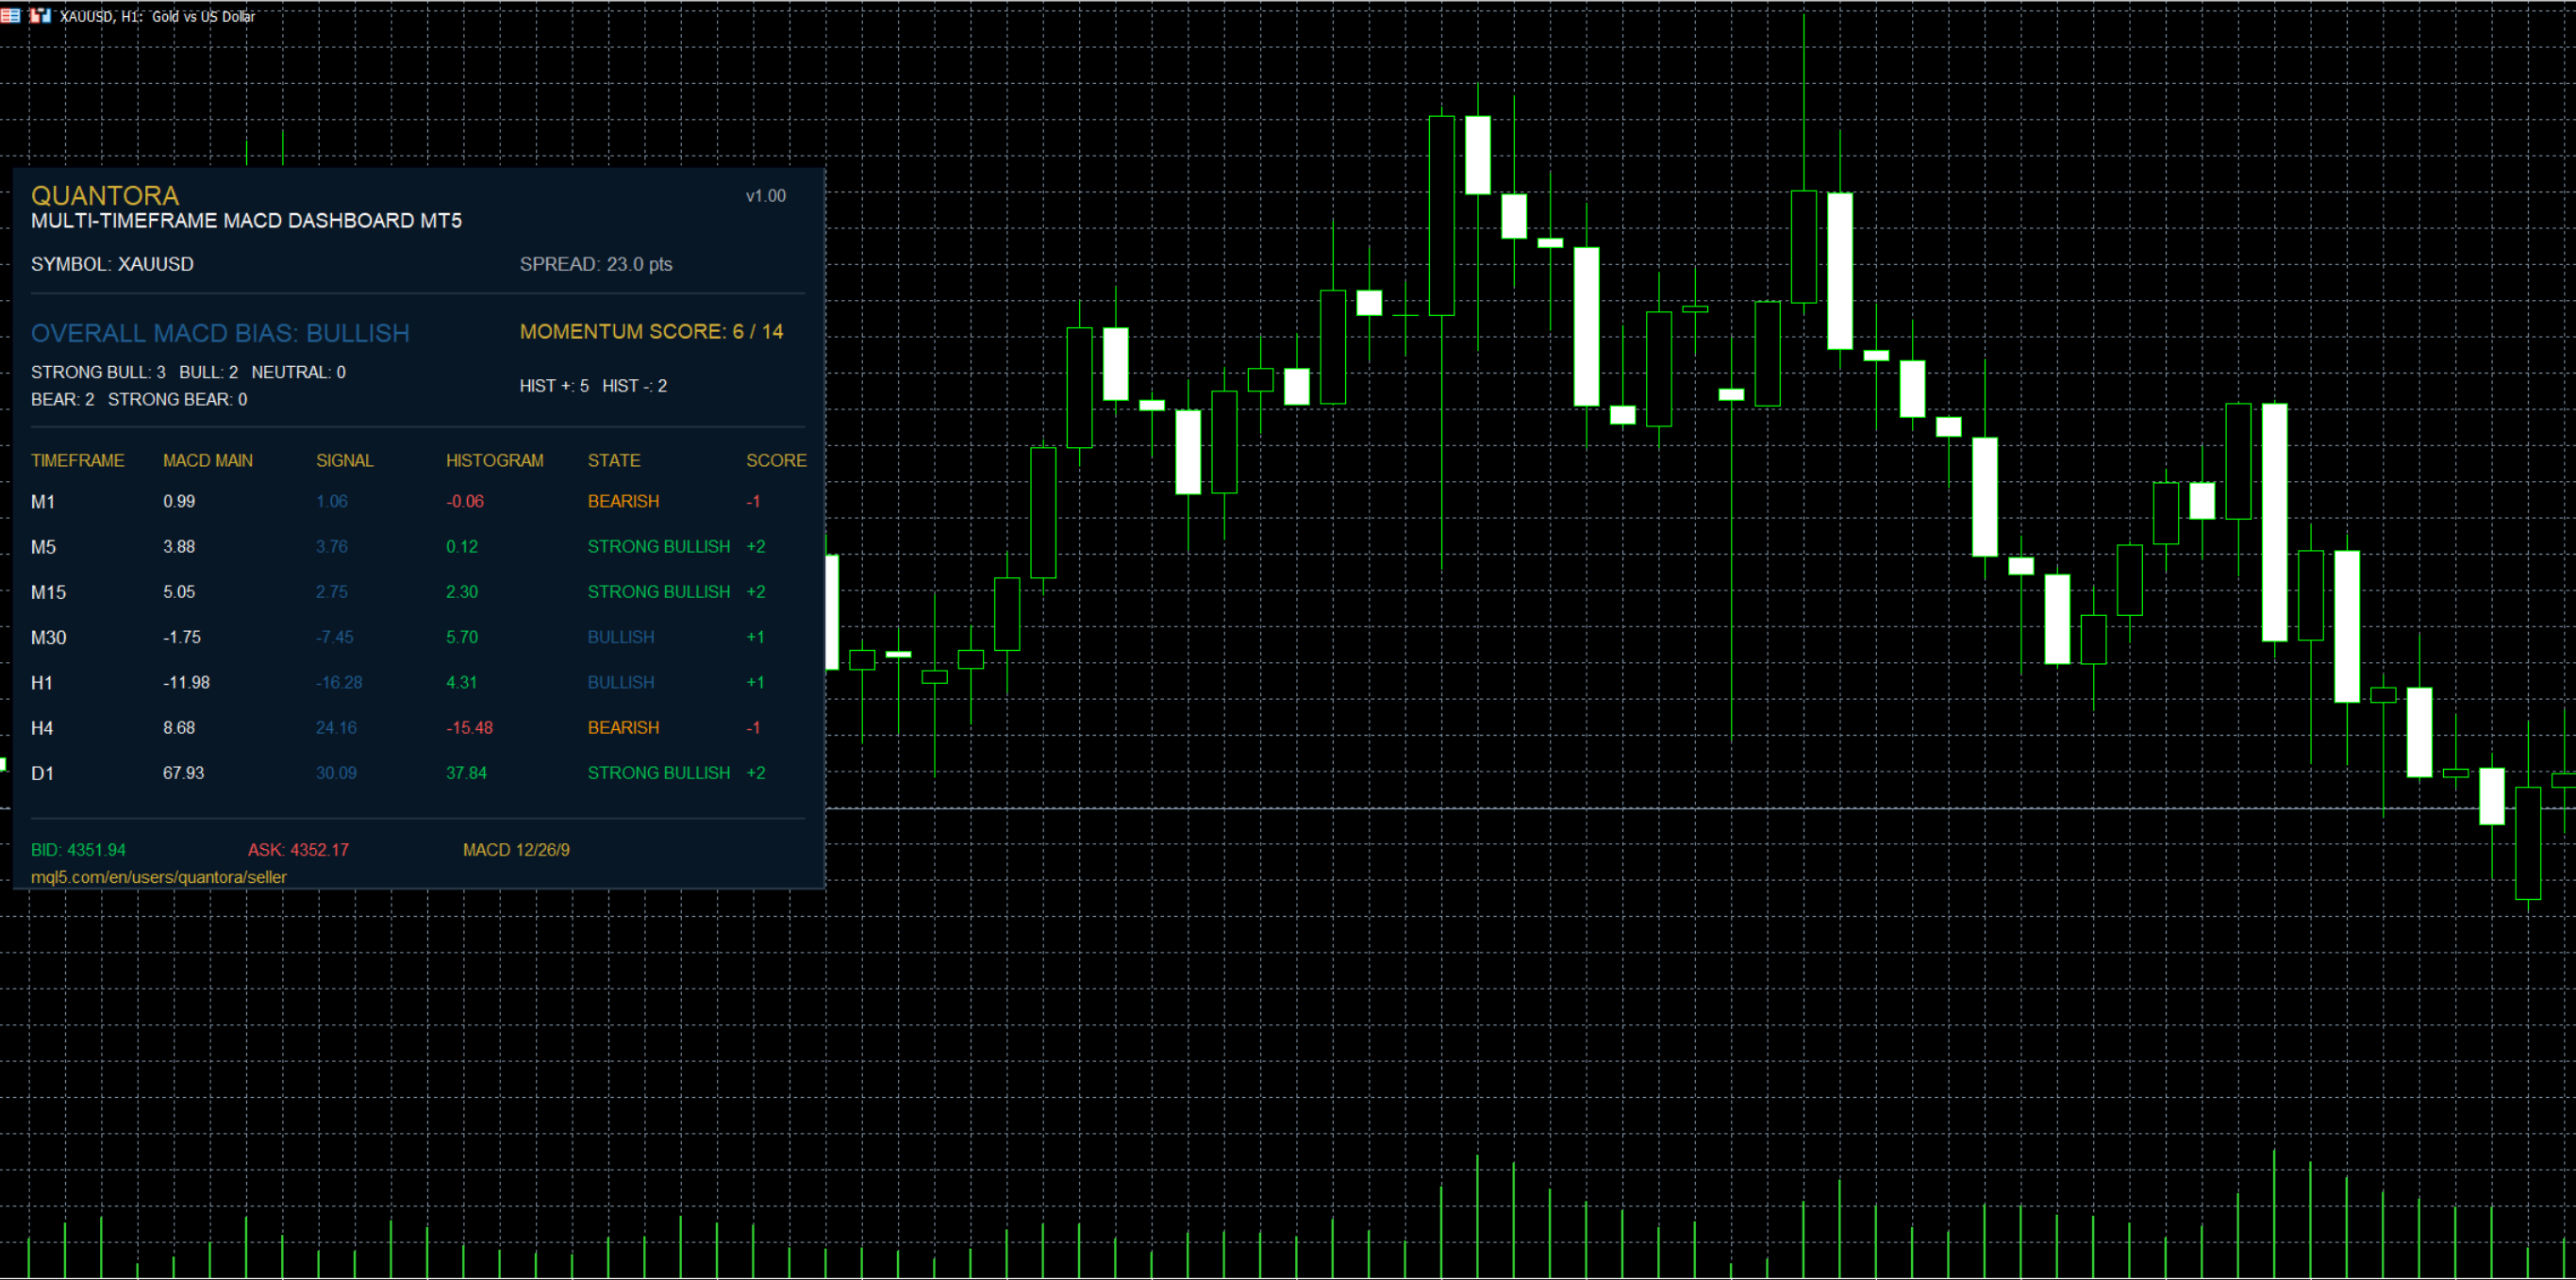
Quantora Multi-Timeframe MACD Dashboard MT5 is a professional multi-timeframe momentum and trend analysis indicator for MetaTrader 5.
The indicator simultaneously analyzes 7 timeframes — M1, M5, M15, M30, H1, H4 and D1 using the standard MACD calculation.
Default configuration:
Fast EMA = 12
Slow EMA = 26
Signal Period = 9 For every timeframe, the dashboard displays the MACD Main value, Signal value, Histogram, Momentum State and individual Score.
All timeframe results are then combined into an Overall MACD Bias and a Multi-Timeframe Momentum Score ranging from -14 to +14.
This makes it possible to monitor short-, medium- and higher-timeframe MACD conditions from a single chart.
Main Features
- M1 / M5 / M15 / M30 simultaneous analysis
- H1 / H4 / D1 simultaneous analysis
- Standard MACD 12 / 26 / 9
- MACD Main values
- MACD Signal values
- MACD Histogram values
- STRONG BULLISH classification
- BULLISH classification
- NEUTRAL classification
- BEARISH classification
- STRONG BEARISH classification
- Individual timeframe Momentum Score
- Overall Momentum Score
- Score range from -14 to +14
- Overall MACD Bias
- Strong Bullish counter
- Bullish counter
- Neutral counter
- Bearish counter
- Strong Bearish counter
- Positive Histogram counter
- Negative Histogram counter
- Live Bid / Ask
- Live Spread
- Adjustable MACD periods
- Automatic dashboard updates
- Professional Quantora interface
- Free and open-source MQ5 code
Multi-Timeframe MACD Analysis
The indicator calculates MACD independently for:
M1
M5
M15
M30
H1
H4
D1 Each timeframe therefore has its own MACD Main, Signal and Histogram values.
Example:
TIMEFRAME MACD MAIN SIGNAL HISTOGRAM STATUS
M1 0.00056 0.00032 0.00024 STRONG BULLISH
M5 0.00125 0.00098 0.00027 STRONG BULLISH
M15 0.00038 0.00045 -0.00007 BEARISH
M30 -0.00035 -0.00018 -0.00017 STRONG BEARISH
H1 -0.00128 -0.00088 -0.00040 STRONG BEARISH
H4 -0.00185 -0.00120 -0.00065 STRONG BEARISH
D1 0.00062 0.00010 0.00052 STRONG BULLISH MACD Histogram
The Histogram is calculated as:
Histogram = MACD Main - Signal Therefore:
Histogram > 0 → Positive momentum relationship
Histogram < 0 → Negative momentum relationship The dashboard also counts the number of positive and negative histogram readings across all seven timeframes.
For example:
POSITIVE HISTOGRAMS: 4
NEGATIVE HISTOGRAMS: 3 Momentum Classification
STRONG BULLISH
MACD Main > Signal
Histogram > 0
MACD Main > 0 Score:
+2 BULLISH
MACD Main > Signal
Histogram > 0
MACD Main <= 0 Score:
+1 NEUTRAL
Conditions that do not meet the defined bullish or bearish classifications receive:
0 BEARISH
MACD Main < Signal
Histogram < 0
MACD Main >= 0 Score:
-1 STRONG BEARISH
MACD Main < Signal
Histogram < 0
MACD Main < 0 Score:
-2 Multi-Timeframe Momentum Score
Each of the seven timeframes contributes between -2 and +2 points.
Therefore, the complete score range is:
Minimum = -14
Maximum = +14 Example:
M1 +2
M5 +1
M15 0
M30 -1
H1 -2
H4 -2
D1 +2
TOTAL SCORE = 0 This provides a numerical summary of MACD alignment across multiple timeframes.
Overall MACD Bias
The total Momentum Score is converted into an Overall MACD Bias.
The current version uses:
+8 to +14 STRONG BULLISH
+3 to +7 BULLISH
-2 to +2 NEUTRAL
-3 to -7 BEARISH
-8 to -14 STRONG BEARISH Example:
MOMENTUM SCORE: +9 / 14
OVERALL MACD BIAS:
STRONG BULLISH The Overall Bias is an analytical summary of the seven MACD readings rather than a direct trading signal.
Momentum Counters
The dashboard also displays the number of timeframes currently classified in each state.
Example:
STRONG BULLISH 2
BULLISH 1
NEUTRAL 1
BEARISH 1
STRONG BEARISH 2 This provides additional context behind the overall Momentum Score.
Configurable MACD Settings
Default parameters:
Fast EMA = 12
Slow EMA = 26
Signal Period = 9 These parameters can be changed from the indicator inputs.
For example:
Fast EMA = 8
Slow EMA = 21
Signal Period = 5 The Slow EMA period must be greater than the Fast EMA period.
Live Market Information
The dashboard also displays current market information for the chart symbol:
SYMBOL EURUSD
BID 1.08940
ASK 1.08955
SPREAD 1.5 points This allows current trading conditions to be monitored together with the MACD analysis.
Automatic Updates
The default dashboard update interval is:
2 seconds The indicator automatically recalculates the seven MACD readings and updates the dashboard while it is running.
Example Dashboard
QUANTORA
MULTI-TIMEFRAME MACD DASHBOARD MT5
────────────────────────────────────────
SYMBOL: EURUSD
MACD: 12 / 26 / 9
OVERALL MACD BIAS: BULLISH
MOMENTUM SCORE: +4 / 14
STRONG BULL: 2
BULL: 1
NEUTRAL: 1
BEAR: 1
STRONG BEAR: 2
HIST +: 4
HIST -: 3
TF MAIN SIGNAL HIST STATE
M1 0.00056 0.00032 0.00024 STRONG BULLISH
M5 0.00125 0.00098 0.00027 STRONG BULLISH
M15 0.00038 0.00045 -0.00007 BEARISH
M30 -0.00035 -0.00018 -0.00017 STRONG BEARISH
H1 -0.00128 -0.00088 -0.00040 STRONG BEARISH
H4 -0.00185 -0.00120 -0.00065 STRONG BEARISH
D1 0.00062 0.00010 0.00052 STRONG BULLISH
BID: 1.08940
ASK: 1.08955
SPREAD: 1.5 pts
STATUS: MONITORING Why Multi-Timeframe MACD?
MACD conditions can vary significantly between timeframes.
For example:
M1 STRONG BULLISH
M5 BULLISH
M15 NEUTRAL
M30 BEARISH
H1 STRONG BEARISH
H4 STRONG BEARISH
D1 STRONG BULLISH A trader analyzing only one timeframe may therefore see a very different momentum picture from the broader market.
Quantora Multi-Timeframe MACD Dashboard brings all seven readings together in one interface.
Installation
Place:
Quantora Multi-Timeframe MACD Dashboard MT5.mq5
inside:
MQL5 → Indicators
Compile the source file using MetaEditor.
Then attach Quantora Multi-Timeframe MACD Dashboard MT5 to any MetaTrader 5 chart.
The dashboard will automatically begin analyzing the current symbol across all seven supported timeframes.
Important Notes
MACD calculations use closing prices and the current forming candle. Values and classifications can therefore change before a candle closes.
A positive MACD Histogram does not guarantee that price will rise, and a negative Histogram does not guarantee that price will fall.
STRONG BULLISH, BULLISH, NEUTRAL, BEARISH and STRONG BEARISH represent the indicator's defined MACD classification model only.
The indicator does not open trades, close positions, modify orders, set Stop Loss or Take Profit, or guarantee future market direction.
It is designed for market monitoring and analytical purposes only.
Product Information
Version: 1.00
Platform: MetaTrader 5
Program Type: Indicator
Category: Indicators / Momentum & Trend Analysis
License: Free / Open Source
Developed by QUANTORA
Professional MetaTrader 5 Trading Tools, Indicators and Expert Advisors.
More Professional Quantora Trading Products
Explore Quantora's professional MetaTrader 5 Expert Advisors, premium indicators and trading tools on the official MQL5 Market:
View All Quantora Products on MQL5 Market →

Quantora Multi-Timeframe RSI Dashboard MT5 - Professional RSI Momentum Analysis
Professional open-source Multi-Timeframe RSI Dashboard for MetaTrader 5. Analyzes RSI across M1, M5, M15, M30, H1, H4 and D1 to monitor momentum, overbought and oversold conditions in real time.
Quantora Multi-Timeframe Trend Dashboard MT5 - Professional EMA Trend Analysis
Professional open-source Multi-Timeframe Trend Dashboard for MetaTrader 5. Analyzes M1 to D1 using EMA 20, EMA 50 and price position to identify Bullish, Bearish and Neutral market conditions.
Quantora Moving Average Dashboard MT5 - Professional EMA SMA Trend Analysis
Professional open-source Moving Average Dashboard for MetaTrader 5. Monitors EMA 20, EMA 50, EMA 100, EMA 200, SMA 50 and SMA 200 with price position, trend structure, MA Score and overall market bias.
Quantora Candle Strength Analyzer MT5 - Buyer Seller Pressure and Wick Analysis
Professional open-source Candle Strength Analyzer for MetaTrader 5. Analyzes candle body, upper and lower wicks, buyer/seller pressure, rejection, range expansion and candle strength in real time.