 MetaTrader 5
 Experts
 Indicators
 Scripts
 Libraries
 Storage
Join our fan page

Previous Day High Low Open Close Indicator - indicator for MetaTrader 5

Building, learning, and sharing one project at a time.
- Views:
- 2007
- Rating:
- Published:
- Updated:
-
 You are missing trading opportunities:
- Free trading apps
- Over 8,000 signals for copying
- Economic news for exploring financial markets
Registration Log inYou agree to website policy and terms of use
If you do not have an account, please register -
 Need a robot or indicator based on this code? Order it on Freelance
Go to Freelance
Need a robot or indicator based on this code? Order it on Freelance
Go to Freelance

The idea behind it
Yesterday's high, low and close are among the most watched reference points in intraday trading — they mark where the last full session found resistance, support, and fair value, and price frequently reacts around them the next day regardless of instrument. This indicator reads those three values straight from the completed Daily (D1) bar and draws them as horizontal levels across the current session, so you always have the prior day's structure visible without having to switch timeframes or calculate it by hand.
It works on any symbol and any intraday timeframe, since the levels themselves come from D1 data regardless of the chart you have open. Optionally, more than one previous day can be shown at once, with each day's High/Low/Close drawn across the specific session it was active for — useful for spotting levels that have been respected or broken repeatedly over the last several days.
How to interpret it
- PDH (Previous Day High) — the highest price reached during the prior completed trading day. Often acts as intraday resistance or a breakout trigger once cleared.
- PDL (Previous Day Low) — the lowest price reached during the prior completed trading day. Often acts as intraday support or a breakdown trigger once broken.
- PDC (Previous Day Close) — the settlement price of the prior day. Commonly used as a fair-value pivot: price trading above it for the session is read as net bullish, below it as net bearish.
- Multi-day stacking — when InpDaysToShow is greater than 1, each older day's level is drawn only across the session it actually applied to, with a "-N" suffix on its label (e.g. PDH-1 , PDH-2 ) so historical and current levels never overlap or get confused with one another.
- Live refresh — levels are rebuilt automatically the moment a new Daily bar opens, so the indicator always reflects the most recently completed session without needing to be removed and re-attached.
External variables (inputs)
| Input | Default | Purpose |
|---|---|---|
| InpDaysToShow | 1 | Number of previous trading days to display (1-10). Each day's levels are drawn only across the session they applied to. |
| InpShowHigh | true | Toggles the Previous Day High line on or off. |
| InpShowLow | true | Toggles the Previous Day Low line on or off. |
| InpShowClose | true | Toggles the Previous Day Close line on or off. |
| InpHighColor / InpLowColor / InpCloseColor | Lime / Red / Silver | Independent colors for each of the three levels. |
| InpLineStyle / InpLineWidth | Dash / 1 | Line style and width applied to all three levels. |
| InpShowLabels | true | Shows a text label (e.g. "PDH") at the right-hand edge of each level. |
| InpShowPriceInLabel | true | Appends the exact price value to each label. |
| InpLabelFontSize | 8 | Font size used for the level labels. |
Recommended use
Works on any symbol and any intraday timeframe (M1–H4 are typical), since the High/Low/Close values are always sourced from the Daily timeframe regardless of the chart period. On symbols that trade around the clock (Gold, major FX pairs, crypto), the "daily" session boundary is whatever your broker's server uses to close and open D1 bars — check this against the session you actually care about (e.g. NY close vs. broker midnight) before relying on the exact level.
All chart objects are created under a single internal name prefix and are fully removed via ObjectsDeleteAll() in OnDeinit() when the indicator is detached, so it leaves nothing behind on the chart.
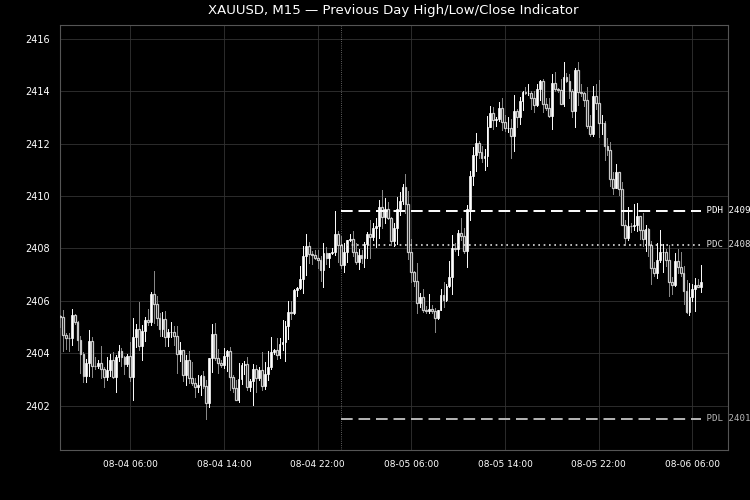
Fig. 1. Previous day's High, Low and Close plotted as horizontal levels across the current session on XAUUSD M15. Rendered in black and white per the Code Base image guidelines (750×500 px).
 Trade Adjustment Panel
On-chart trade management utility for MetaTrader 5 designed exclusively to adjust existing manual or EA positions. Features one-click controls for Break-Even placement, point offsets, profit locking, trailing stops, Risk-to-Reward (1R–3R) Take Profit targets, and volume-validated partial closures (25%–100%). Includes a draggable chart GUI and filtering by symbol and direction. Does not open new trades.
Quantora Candle Strength Analyzer MT5 - Buyer Seller Pressure and Wick Analysis
Professional open-source Candle Strength Analyzer for MetaTrader 5. Analyzes candle body, upper and lower wicks, buyer/seller pressure, rejection, range expansion and candle strength in real time.
Stochastic Reversal Signal
A non-repainting Stochastic-based indicator that generates buy and sell signals based on extreme zone crossovers, featuring an alternating signal filter and bar-close alerts.
Trend Regime Inspector for MetaTrader 5
Open-source indicator combining moving-average direction, ADX and Kaufman's Efficiency Ratio into a transparent trend-condition score. Informational only; no trade execution.