Join our fan page
Quantora Moving Average Dashboard MT5 - Professional EMA SMA Trend Analysis - indicator for MetaTrader 5
- Views:
- 111
- Published:
-
Need a robot or indicator based on this code? Order it on Freelance Go to Freelance
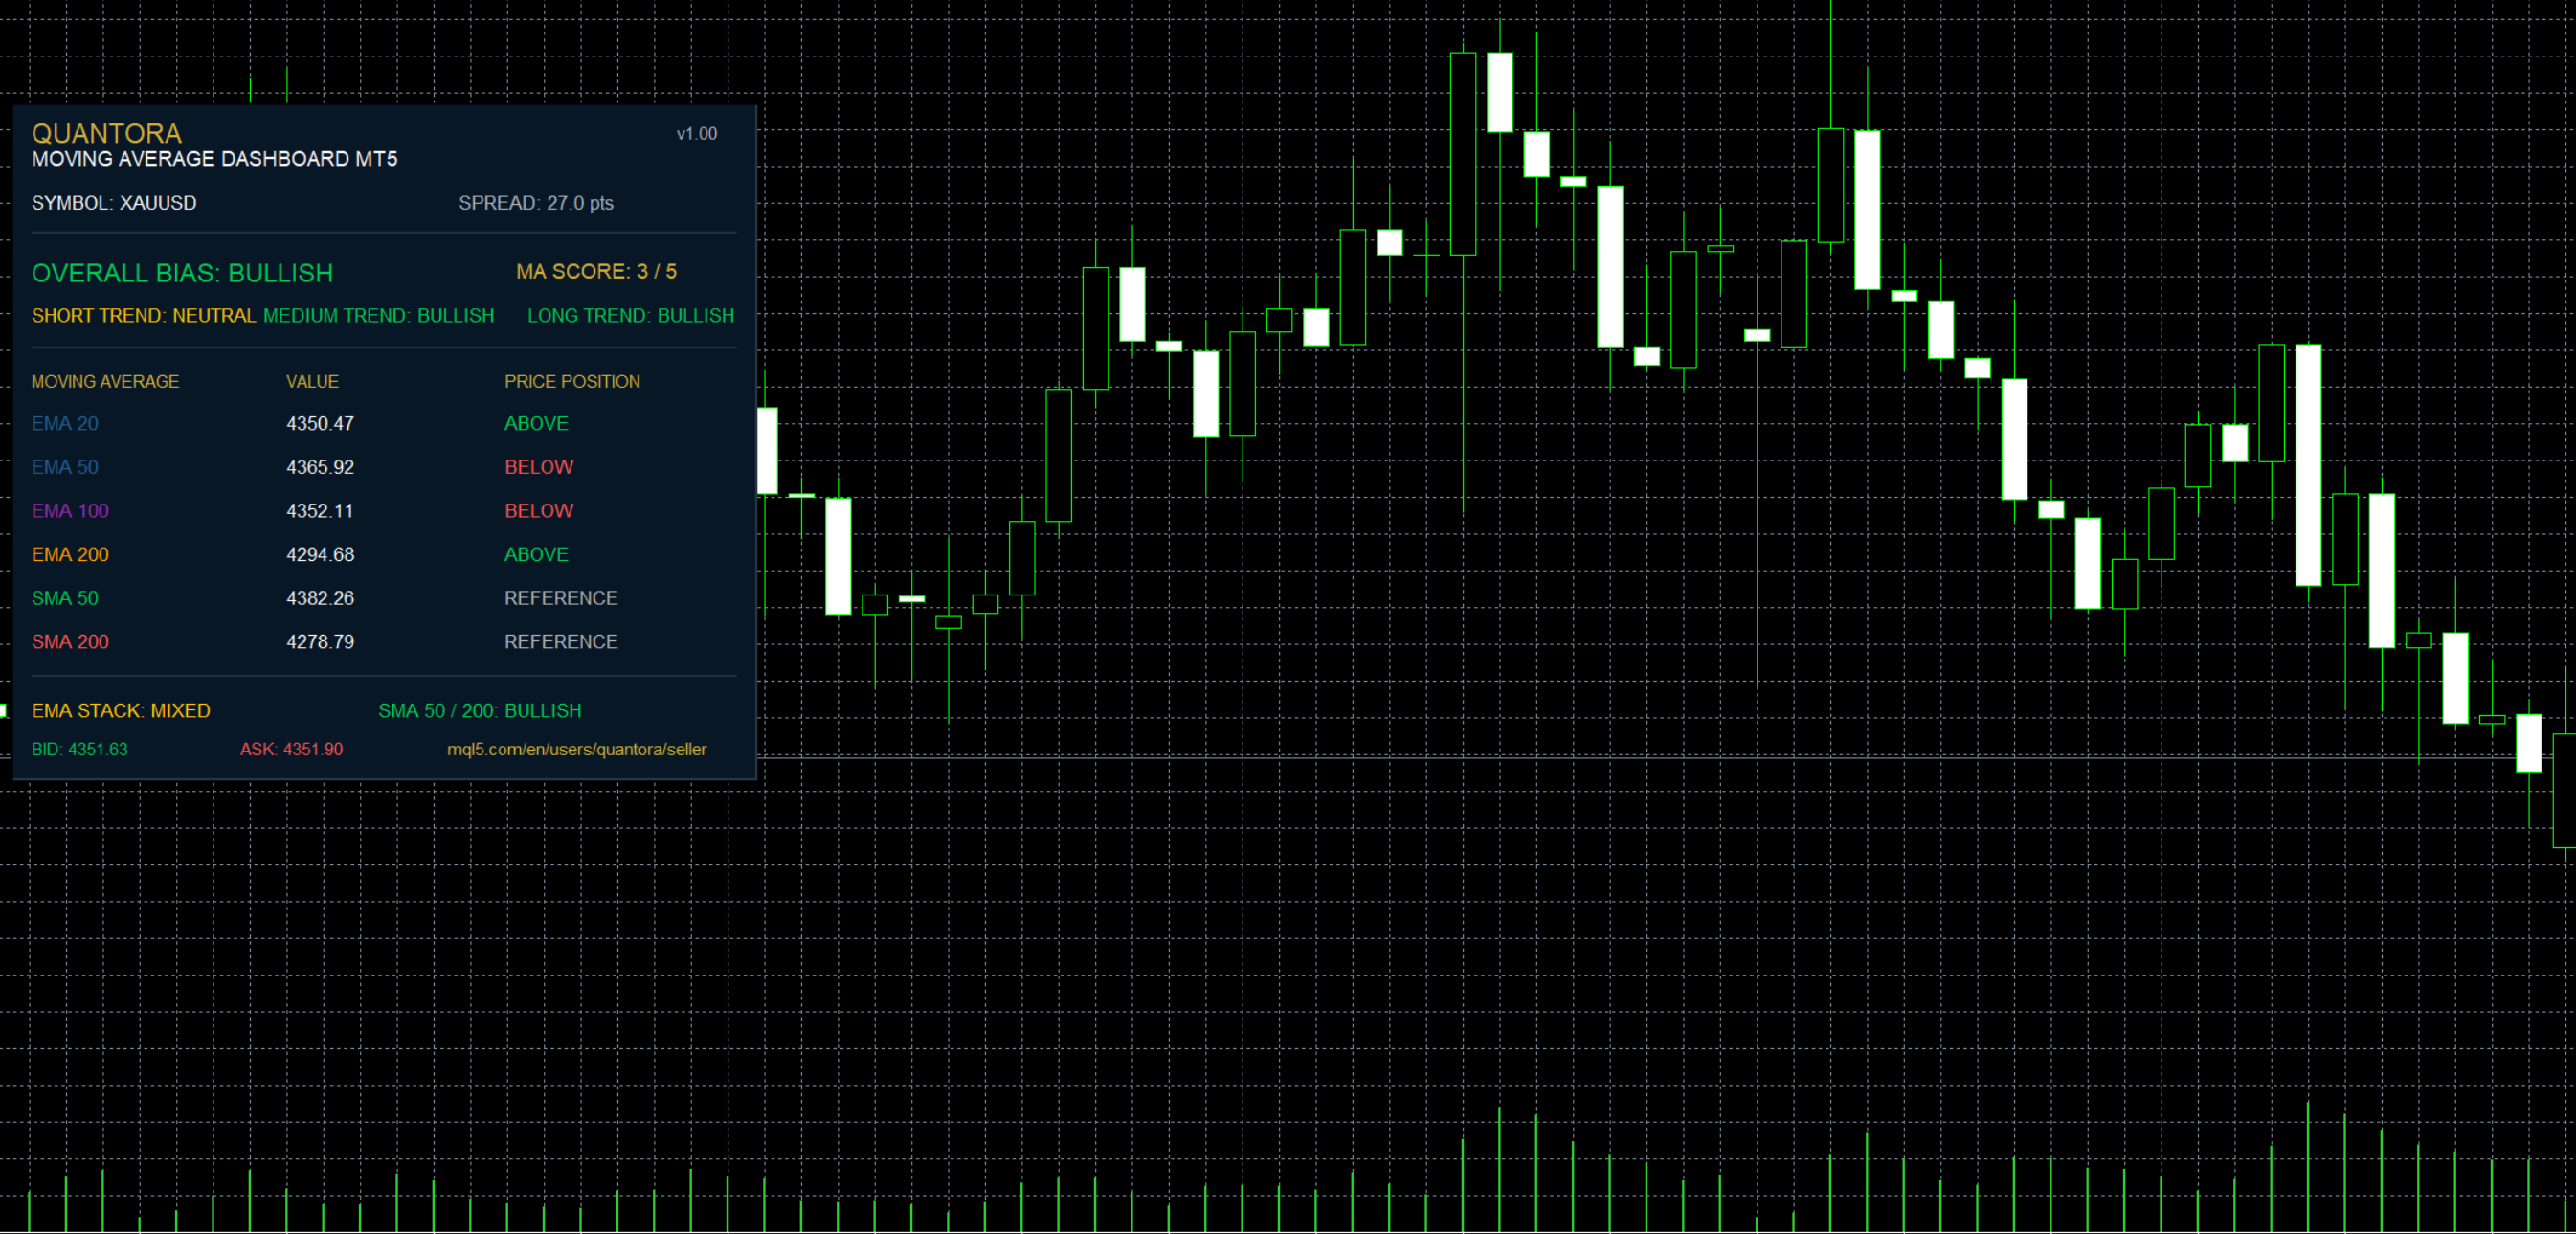
Quantora Moving Average Dashboard MT5 is a professional trend-monitoring indicator designed to analyze multiple key moving averages from a single MetaTrader 5 dashboard.
Instead of manually checking several moving averages, the indicator automatically monitors:
EMA 20
EMA 50
EMA 100
EMA 200
SMA 50
SMA 200 The dashboard analyzes the current price position, EMA alignment, SMA 50/200 relationship and short-, medium- and long-term trend structure.
These conditions are combined into an MA Score ranging from -5 to +5 and an easy-to-read Overall Market Bias.
Main Features
- EMA 20 monitoring
- EMA 50 monitoring
- EMA 100 monitoring
- EMA 200 monitoring
- SMA 50 monitoring
- SMA 200 monitoring
- Current moving average values
- Price ABOVE / BELOW EMA analysis
- Short-Term Trend analysis
- Medium-Term Trend analysis
- Long-Term Trend analysis
- EMA Stack detection
- SMA 50 / SMA 200 relationship
- Bullish and Bearish MA alignment
- MA Score from -5 to +5
- Overall Market Bias
- STRONG BULLISH condition
- BULLISH condition
- NEUTRAL condition
- BEARISH condition
- STRONG BEARISH condition
- Live Bid / Ask
- Live Spread
- Adjustable MA periods
- Automatic dashboard updates
- Professional Quantora interface
- Free and open-source MQ5 code
Moving Averages
The default configuration uses six commonly monitored moving averages:
EMA 20
EMA 50
EMA 100
EMA 200
SMA 50
SMA 200 The EMA group provides information about short-, medium- and long-term trend alignment.
The SMA 50 and SMA 200 relationship provides an additional longer-term trend reference.
All periods can be modified from the indicator inputs.
Price Position Analysis
The dashboard compares the current market price with the four EMA values.
Each EMA is classified as:
ABOVE
BELOW
AT MA For example:
CURRENT PRICE = 1.08940
EMA 20 = 1.08910 ABOVE
EMA 50 = 1.08836 ABOVE
EMA 100 = 1.08684 ABOVE
EMA 200 = 1.08321 ABOVE This means that the current price is trading above all four monitored exponential moving averages.
Short-Term Trend
The Short-Term Trend uses:
Current Price
EMA 20
EMA 50 Bullish
Price > EMA 20 > EMA 50 Bearish
Price < EMA 20 < EMA 50 Other configurations are classified as:
NEUTRAL Medium-Term Trend
The Medium-Term Trend analyzes:
EMA 50
EMA 100
EMA 200 Bullish structure:
EMA 50 > EMA 100 > EMA 200 Bearish structure:
EMA 50 < EMA 100 < EMA 200 Mixed alignment is classified as Neutral.
Long-Term Trend
The Long-Term Trend combines price position with the 200-period moving averages and SMA relationship.
Bullish conditions require:
Price > EMA 200
Price > SMA 200
SMA 50 > SMA 200 Bearish conditions require:
Price < EMA 200
Price < SMA 200
SMA 50 < SMA 200 Otherwise, the Long-Term Trend remains Neutral.
EMA Stack Analysis
The dashboard detects complete EMA alignment.
Bullish EMA Stack
EMA 20 > EMA 50 > EMA 100 > EMA 200 Displayed as:
BULLISH STACK Bearish EMA Stack
EMA 20 < EMA 50 < EMA 100 < EMA 200 Displayed as:
BEARISH STACK If neither structure exists:
MIXED This makes it easy to identify whether multiple moving averages are aligned in the same direction.
SMA 50 / SMA 200 Analysis
The dashboard also compares the two simple moving averages.
SMA 50 > SMA 200
→ BULLISH
SMA 50 < SMA 200
→ BEARISH This relationship can provide additional context for longer-term market structure.
MA Score
Five independent components contribute to the overall score:
1. Short-Term Trend
2. Medium-Term Trend
3. Long-Term Trend
4. EMA Stack
5. SMA 50 / SMA 200 Bullish conditions contribute:
+1 Bearish conditions contribute:
-1 Neutral or mixed conditions contribute:
0 Therefore:
Maximum Score = +5
Minimum Score = -5 Example:
Short Trend +1
Medium Trend +1
Long Trend +1
EMA Stack +1
SMA 50/200 0
TOTAL MA SCORE +4 / 5 Overall Market Bias
The MA Score is converted into an overall trend classification:
+4 to +5 STRONG BULLISH
+2 to +3 BULLISH
-1 to +1 NEUTRAL
-2 to -3 BEARISH
-4 to -5 STRONG BEARISH For example:
MA SCORE: +4 / 5
OVERALL BIAS:
STRONG BULLISH This provides a quick summary without requiring the user to interpret every moving average individually.
Example Dashboard
QUANTORA
MOVING AVERAGE DASHBOARD MT5
────────────────────────────────────
SYMBOL: EURUSD
SPREAD: 1.5 pts
OVERALL BIAS: STRONG BULLISH
MA SCORE: +4 / 5
SHORT TREND: BULLISH
MEDIUM TREND: BULLISH
LONG TREND: BULLISH
MOVING AVERAGE VALUE PRICE POSITION
EMA 20 1.08910 ABOVE
EMA 50 1.08836 ABOVE
EMA 100 1.08684 ABOVE
EMA 200 1.08321 ABOVE
SMA 50 1.08712
SMA 200 1.08245
EMA STACK:
BULLISH STACK
SMA 50 / SMA 200:
BULLISH
BID: 1.08940
ASK: 1.08955
STATUS: MONITORING Adjustable Parameters
All moving average periods can be customized.
Default:
EMA 20 Period = 20
EMA 50 Period = 50
EMA 100 Period = 100
EMA 200 Period = 200
SMA 50 Period = 50
SMA 200 Period = 200 The dashboard update interval can also be adjusted.
Default:
Update Interval = 2 seconds Automatic Updates
The indicator automatically updates the moving average values, price relationships, trend classifications, MA Score and Overall Bias while attached to the chart.
There is no need to manually refresh the dashboard.
Supported Markets
The indicator can be attached to broker-supported MetaTrader 5 instruments such as:
- Forex
- Gold and other metals
- Indices
- Commodities
- Crypto CFDs
- Other supported symbols
Calculations are performed using the symbol and timeframe of the chart to which the indicator is attached.
Installation
Place:
Quantora Moving Average Dashboard MT5.mq5
inside:
MQL5 → Indicators
Compile the source file using MetaEditor.
Then attach Quantora Moving Average Dashboard MT5 to the desired chart.
The dashboard will automatically begin monitoring the current symbol and timeframe.
Important Notes
Moving averages are lagging technical indicators based on historical price information.
A Bullish or Bearish classification does not guarantee that the market will continue moving in that direction.
The MA Score, EMA Stack, Short/Medium/Long Trend and Overall Bias are analytical classifications generated according to the rules described above.
The indicator does not:
- Open trades
- Close positions
- Modify orders
- Set Stop Loss
- Set Take Profit
- Guarantee future market direction
It is intended as a market analysis and monitoring tool.
Product Information
Version: 1.00
Platform: MetaTrader 5
Program Type: Indicator
Category: Indicators / Trend Analysis
License: Free / Open Source
Developed by QUANTORA
Professional MetaTrader 5 Trading Tools, Indicators and Expert Advisors.
More Professional Quantora Trading Products
Explore Quantora's professional MetaTrader 5 Expert Advisors, premium indicators and trading tools on the official MQL5 Market:
Quantora Multi-Timeframe MACD Dashboard MT5 - Professional MACD Momentum Analysis
Professional open-source Multi-Timeframe MACD Dashboard for MetaTrader 5. Analyzes MACD Main, Signal and Histogram across M1, M5, M15, M30, H1, H4 and D1 with an overall momentum score and market bias.
Quantora Multi-Timeframe RSI Dashboard MT5 - Professional RSI Momentum Analysis
Professional open-source Multi-Timeframe RSI Dashboard for MetaTrader 5. Analyzes RSI across M1, M5, M15, M30, H1, H4 and D1 to monitor momentum, overbought and oversold conditions in real time.
Quantora Candle Strength Analyzer MT5 - Buyer Seller Pressure and Wick Analysis
Professional open-source Candle Strength Analyzer for MetaTrader 5. Analyzes candle body, upper and lower wicks, buyer/seller pressure, rejection, range expansion and candle strength in real time.
Trade Adjustment Panel
On-chart trade management utility for MetaTrader 5 designed exclusively to adjust existing manual or EA positions. Features one-click controls for Break-Even placement, point offsets, profit locking, trailing stops, Risk-to-Reward (1R–3R) Take Profit targets, and volume-validated partial closures (25%–100%). Includes a draggable chart GUI and filtering by symbol and direction. Does not open new trades.
