Watch how to download trading robots for free
Find us on Twitter!
Join our fan page
Interesting script?
So post a link to it -
let others appraise it
You liked the script? Try it in the MetaTrader 5 terminal
Indicators

Quantora Multi-Timeframe Trend Dashboard MT5 - Professional EMA Trend Analysis - indicator for MetaTrader 5

Views:
144
Published:
MQL5 Freelance Need a robot or indicator based on this code? Order it on Freelance Go to Freelance
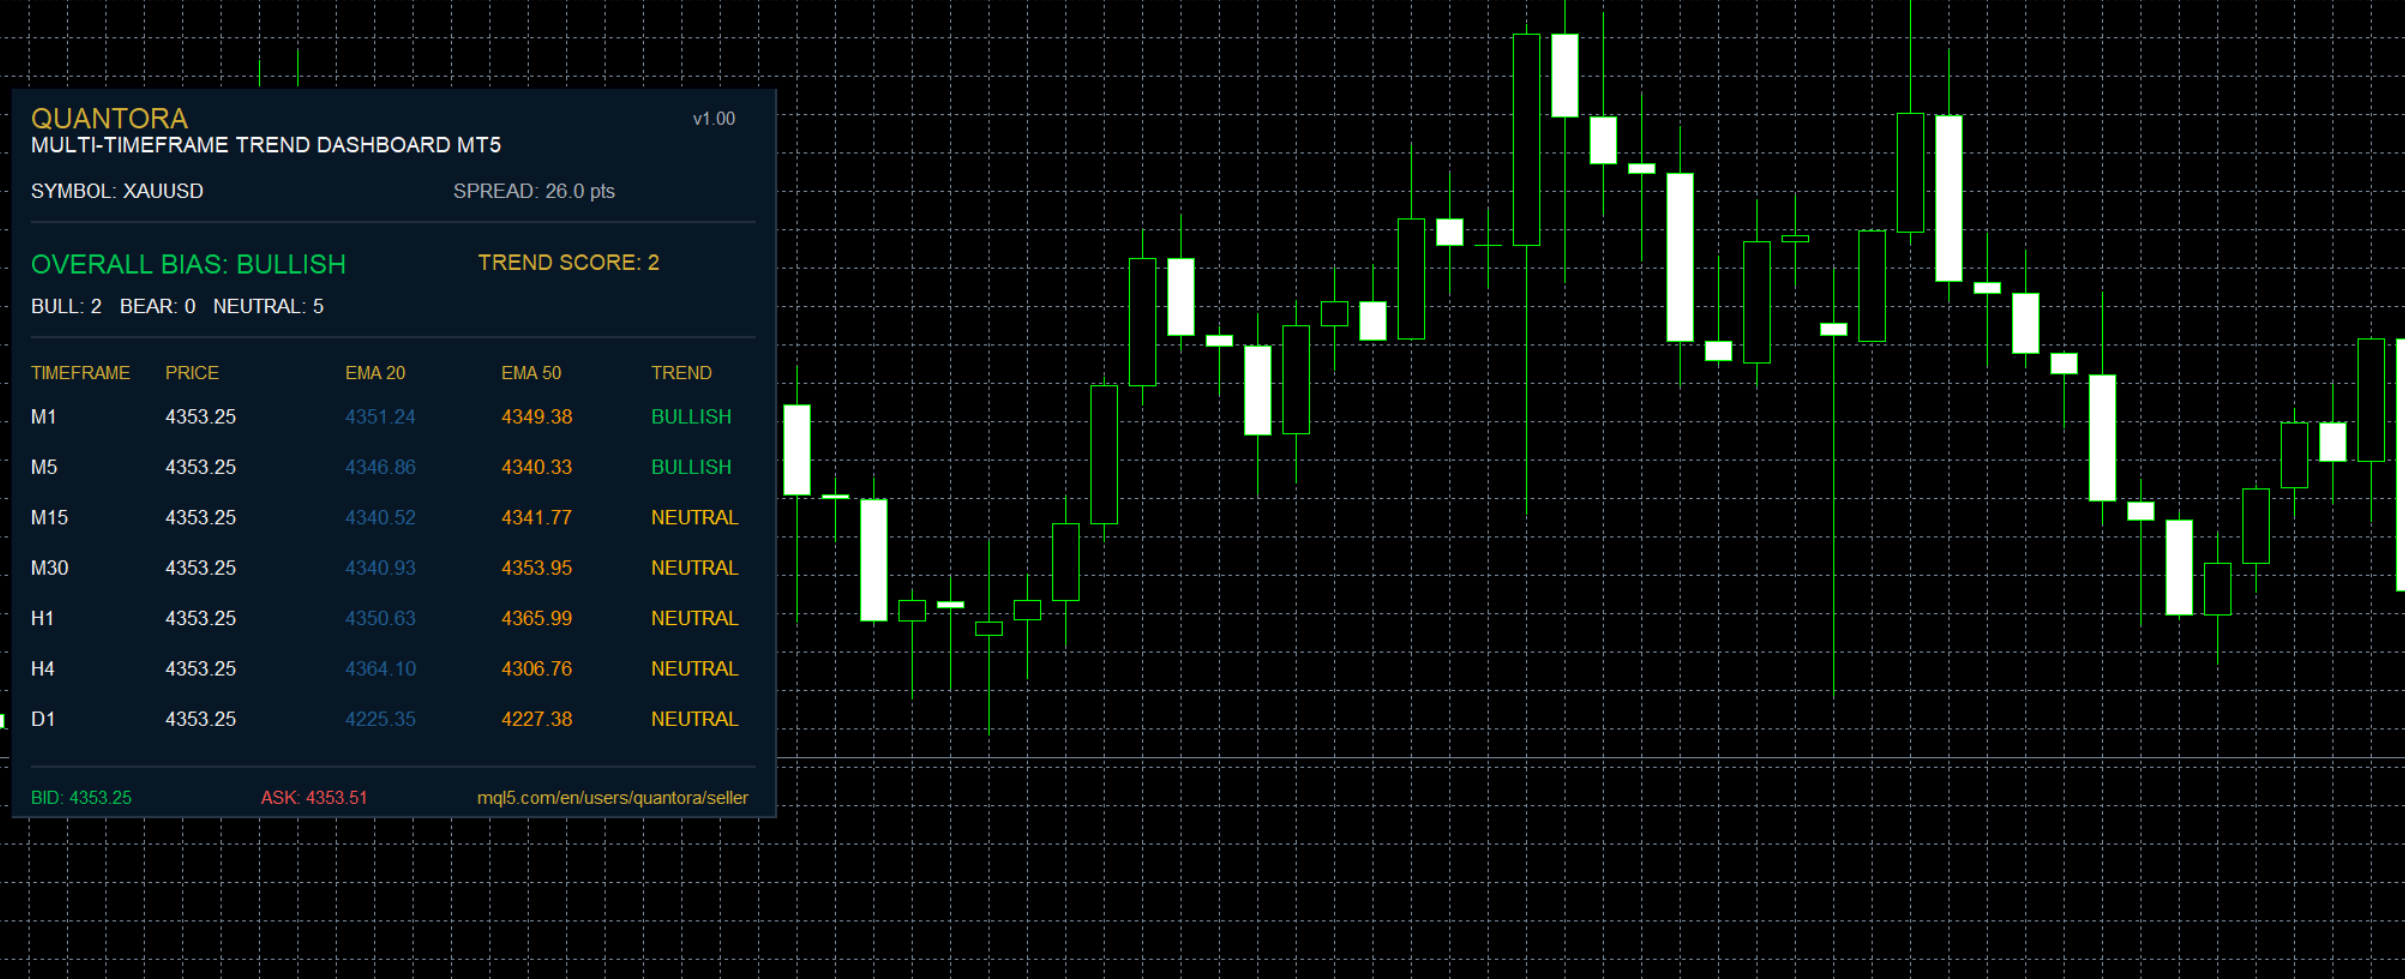

Quantora Multi-Timeframe Trend Dashboard MT5 is a professional multi-timeframe market trend analysis indicator designed for MetaTrader 5.

The indicator simultaneously analyzes 7 different timeframes — M1, M5, M15, M30, H1, H4 and D1 — using a simple and transparent EMA-based trend model.

Each timeframe is independently classified as:

BULLISH — BEARISH — NEUTRAL

The results are combined into a Trend Score from -7 to +7 and an Overall Market Bias ranging from STRONG BEARISH to STRONG BULLISH.

This allows traders to quickly understand whether different market timeframes are aligned or showing mixed conditions without manually switching between charts.

Main Features

  • 7 Timeframe simultaneous analysis
  • M1 analysis
  • M5 analysis
  • M15 analysis
  • M30 analysis
  • H1 analysis
  • H4 analysis
  • D1 analysis
  • Fast EMA calculation
  • Slow EMA calculation
  • Default EMA 20 / EMA 50
  • Current price vs Fast EMA analysis
  • Fast EMA vs Slow EMA analysis
  • BULLISH classification
  • BEARISH classification
  • NEUTRAL classification
  • Trend Score from -7 to +7
  • Bullish timeframe counter
  • Bearish timeframe counter
  • Neutral timeframe counter
  • Overall Market Bias
  • STRONG BULLISH condition
  • BULLISH condition
  • MIXED condition
  • BEARISH condition
  • STRONG BEARISH condition
  • Live Bid
  • Live Ask
  • Current Spread
  • Configurable EMA periods
  • Automatic updates
  • Professional Quantora dashboard
  • Works with Forex, Gold, Indices, Crypto and other broker-supported symbols
  • Free and open-source MQ5 code

Trend Analysis Logic

Each timeframe is analyzed independently using:

Current Price
Fast EMA
Slow EMA

Default settings are:

                                                                                    Fast EMA = 20
Slow EMA = 50

Bullish Trend

A timeframe is classified as BULLISH when:

                                                                                    Price > EMA 20 > EMA 50

This means that the current price is above the fast EMA and the fast EMA is above the slow EMA.

The timeframe receives:

                                                                                    Trend Score = +1

Bearish Trend

A timeframe is classified as BEARISH when:

                                                                                    Price < EMA 20 < EMA 50

The timeframe receives:

                                                                                    Trend Score = -1

Neutral Trend

If neither complete bullish nor complete bearish alignment exists, the timeframe is classified as:

                                                                                    NEUTRAL

The timeframe receives:

                                                                                    Trend Score = 0

This prevents partial EMA alignment from automatically being classified as a confirmed trend.

Multi-Timeframe Analysis

The following timeframes are analyzed simultaneously:

                                                                                    M1
M5
M15
M30
H1
H4
D1

For example:

                                                                                    TIMEFRAME    PRICE      EMA20      EMA50      TREND

M1          1.08945    1.08910    1.08872    BULLISH
M5          1.08940    1.08905    1.08880    BULLISH
M15         1.08920    1.08955    1.08910    NEUTRAL
M30         1.08890    1.08960    1.08740    NEUTRAL
H1          1.08830    1.08890    1.08980    BEARISH
H4          1.08540    1.08620    1.08740    BEARISH
D1          1.07890    1.07980    1.08090    BEARISH

This provides a compact overview of short-, medium- and higher-timeframe market structure.

Trend Score

Each timeframe contributes to the overall Trend Score.

                                                                                    BULLISH = +1
NEUTRAL =  0
BEARISH = -1

With seven timeframes, the possible score range is:

                                                                                    -7 to +7

Example:

                                                                                    Bullish Timeframes = 2
Bearish Timeframes = 3
Neutral Timeframes = 2

Trend Score = -1

The Trend Score provides a quick numerical representation of overall timeframe alignment.

Overall Market Bias

The combined Trend Score is converted into an Overall Bias.

The current version uses:

                                                                                    +5 to +7     STRONG BULLISH

+2 to +4     BULLISH

-1 to +1     MIXED

-2 to -4     BEARISH

-5 to -7     STRONG BEARISH

For example:

                                                                                    TREND SCORE: +6

OVERALL BIAS:
STRONG BULLISH

Or:

                                                                                    TREND SCORE: -1

OVERALL BIAS:
MIXED

Bull / Bear / Neutral Counters

In addition to the numerical score, the dashboard shows how many timeframes belong to each condition.

Example:

                                                                                    BULLISH TIMEFRAMES     4
BEARISH TIMEFRAMES     2
NEUTRAL TIMEFRAMES     1

This makes it easier to understand how the final Trend Score was formed.

Configurable EMA Periods

The default configuration is:

                                                                                    Fast EMA Period = 20
Slow EMA Period = 50

Both periods can be changed from the indicator inputs.

For example:

                                                                                    Fast EMA Period = 50
Slow EMA Period = 200

This allows users to adapt the dashboard to different trend-analysis methods.

The Slow EMA period must be greater than the Fast EMA period.

Live Market Information

The dashboard also monitors current market data for the chart symbol.

Displayed information includes:

                                                                                    SYMBOL       EURUSD

BID          1.08940
ASK          1.08955
SPREAD       1.5 points

Spread is calculated using the broker's symbol point size.

Automatic Updates

The dashboard automatically recalculates the multi-timeframe trend information.

Default:

                                                                                    Update Interval = 2 seconds

The interval can be changed from the indicator inputs.

This allows all seven timeframe conditions to remain updated without manually refreshing the chart.

Example Dashboard

                                                                                    QUANTORA
MULTI-TIMEFRAME TREND DASHBOARD MT5
────────────────────────────────────────

SYMBOL: EURUSD
SPREAD: 1.5 pts

OVERALL BIAS: MIXED
TREND SCORE: -1

BULL: 2    BEAR: 3    NEUTRAL: 2

TIMEFRAME   PRICE      EMA20      EMA50     TREND

M1          1.08945    1.08910    1.08872   BULLISH
M5          1.08940    1.08905    1.08880   BULLISH
M15         1.08920    1.08955    1.08910   NEUTRAL
M30         1.08890    1.08960    1.08740   NEUTRAL
H1          1.08830    1.08890    1.08980   BEARISH
H4          1.08540    1.08620    1.08740   BEARISH
D1          1.07890    1.07980    1.08090   BEARISH

BID: 1.08940
ASK: 1.08955

STATUS: MONITORING

Why Multi-Timeframe Analysis?

A market may appear bullish on a short timeframe while remaining bearish on higher timeframes.

For example:

                                                                                    M1      BULLISH
M5      BULLISH
M15     NEUTRAL
M30     NEUTRAL
H1      BEARISH
H4      BEARISH
D1      BEARISH

Looking only at M1 or M5 could therefore provide a very different picture from the broader market structure.

Quantora Multi-Timeframe Trend Dashboard brings these conditions together in a single panel.

Installation

Place:

Quantora Multi-Timeframe Trend Dashboard MT5.mq5

inside:

MQL5 → Indicators

Compile the source file using MetaEditor.

Then attach Quantora Multi-Timeframe Trend Dashboard MT5 to any MetaTrader 5 chart.

The indicator will automatically analyze the current chart symbol across all seven supported timeframes.

Important Notes

EMA calculations use closing prices.

The current bar is used for the displayed EMA and price values, meaning conditions may change while a candle is still forming.

A BULLISH or BEARISH classification represents only the EMA alignment defined by this indicator.

The Overall Bias and Trend Score are analytical summaries and should not be interpreted as guaranteed trading signals.

The indicator does not:

  • Open positions
  • Close positions
  • Modify trades
  • Set Stop Loss
  • Set Take Profit
  • Predict future price movements
  • Guarantee trend continuation

It is designed for multi-timeframe market monitoring and analytical purposes only.

Product Information

Version: 1.00
Platform: MetaTrader 5
Program Type: Indicator
Category: Indicators / Trend Analysis
License: Free / Open Source

Developed by QUANTORA

Professional MetaTrader 5 Trading Tools, Indicators and Expert Advisors.

More Professional Quantora Trading Products

Explore Quantora's professional MetaTrader 5 Expert Advisors, premium indicators and trading tools on the official MQL5 Market:

View All Quantora Products on MQL5 Market →

Quantora Market Volatility Monitor MT5 - Professional ATR and Volatility Dashboard Quantora Market Volatility Monitor MT5 - Professional ATR and Volatility Dashboard

Professional open-source Market Volatility Monitor for MetaTrader 5. Analyzes current ATR, average ATR, ATR ratio, daily range and spread to classify market volatility in real time.

Quantora Drawdown Monitor MT5 - Professional Account Risk and Drawdown Dashboard Quantora Drawdown Monitor MT5 - Professional Account Risk and Drawdown Dashboard

Professional open-source Drawdown Monitor for MetaTrader 5. Tracks current, daily and peak-equity drawdown, floating P/L, margin levels and configurable account risk conditions in real time.

Quantora Multi-Timeframe RSI Dashboard MT5 - Professional RSI Momentum Analysis Quantora Multi-Timeframe RSI Dashboard MT5 - Professional RSI Momentum Analysis

Professional open-source Multi-Timeframe RSI Dashboard for MetaTrader 5. Analyzes RSI across M1, M5, M15, M30, H1, H4 and D1 to monitor momentum, overbought and oversold conditions in real time.

Quantora Multi-Timeframe MACD Dashboard MT5 - Professional MACD Momentum Analysis Quantora Multi-Timeframe MACD Dashboard MT5 - Professional MACD Momentum Analysis

Professional open-source Multi-Timeframe MACD Dashboard for MetaTrader 5. Analyzes MACD Main, Signal and Histogram across M1, M5, M15, M30, H1, H4 and D1 with an overall momentum score and market bias.