 MetaTrader 5
 Experts
 Indicators
 Scripts
 Libraries
 Storage
Join our fan page

Draw On Liquidity + Kill Zone - indicator for MetaTrader 5

- Views:
- 2736
- Rating:
- Published:
- Updated:
-
 You are missing trading opportunities:
- Free trading apps
- Over 8,000 signals for copying
- Economic news for exploring financial markets
Registration Log inYou agree to website policy and terms of use
If you do not have an account, please register -
 Need a robot or indicator based on this code? Order it on Freelance
Go to Freelance
Need a robot or indicator based on this code? Order it on Freelance
Go to Freelance

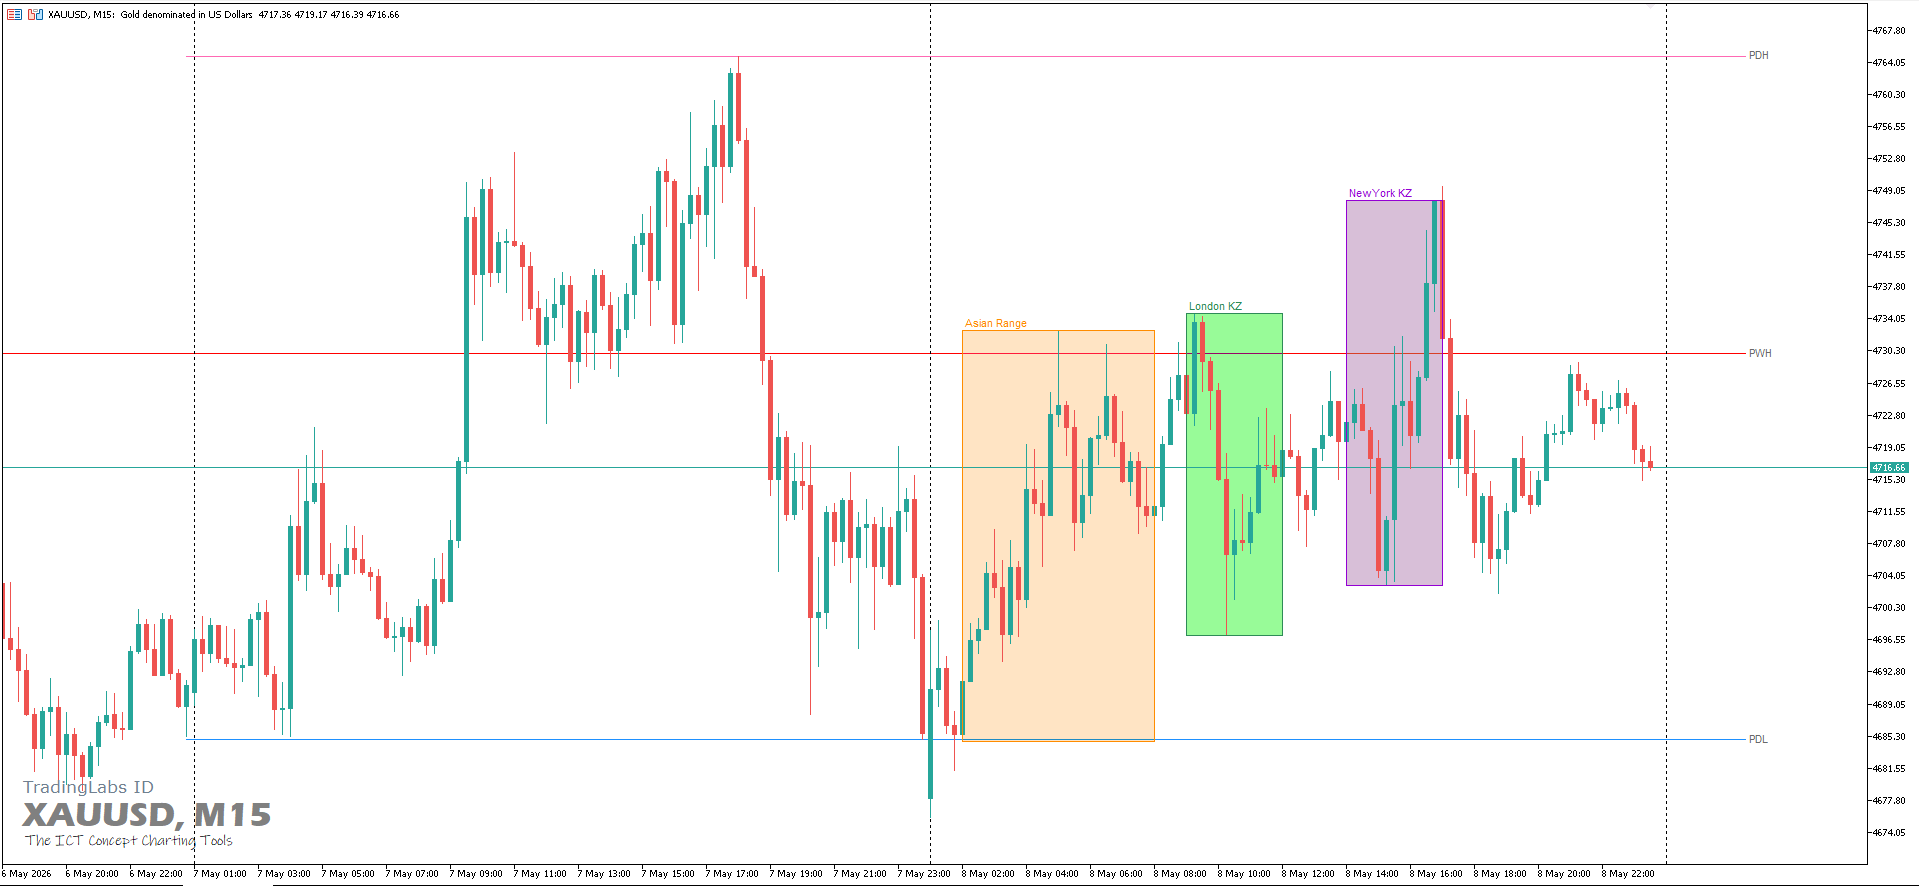
Liquidity levels often act as magnets for price movement. The highs and lows of the previous day (PDHL) and week (PWHL) are key reference points where stop orders and institutional activity tend to cluster. Identifying these levels manually is time-consuming and prone to error.
The Draw On Liquidity (DOL) indicator automatically plots these essential levels on your chart and highlights high-probability trading windows through session kill zones. With full customization options, it provides a clean, professional, and highly informative display to enhance your trading decisions.
Key Features :-
Automatic PDHL & PWHL Plotting – Instantly displays the previous day’s and week’s highs/lows with precision.
-
Liquidity Zone Visualization – Clearly see where liquidity pools are likely to be targeted by price.
-
Session Kill Zones – Mark the Tokyo, London, and New York sessions with customizable times to focus on the most active trading hours.
-
Fully Customizable – Adjust colors, line styles, thickness, and labels to match your preferred chart setup.
-
Clean & User-Friendly – All inputs are logically grouped for quick setup without chart clutter.
-
Save time by removing the need for manual line drawing.
-
Anticipate price movements around key liquidity levels.
-
Focus on the most relevant sessions for trading opportunities.
-
Maintain a professional and structured chart layout.
-
Show/Hide Previous Daily & Weekly High/Low
-
Adjustable line styles, widths, and colors
-
Customizable text labels (color & size)
-
Session markers with start/end times (Tokyo, London, New York)
-
Days to display past sessions
Asian Session Breakout / BhanuCodeLab
Asian Session Breakout identifies the price range formed during the Asian trading session and monitors how price behaves after that session ends. The Asian High and Asian Low remain extended until the end of the broker trading day. This makes the range useful as an intraday support-and-resistance zone during the European and US sessions. A compact dashboard displays the current range values, configured session time, breakout status, breakout confirmation method, and confirmation timeframe. The indicator does not open or manage trades. It provides market structure and breakout information for discretionary trading or EA development.
 EA Money Management
A simple indicator based on trend criteria
Breakout Distance - Donchian channel with distance-to-trigger panel in ATR units
Most channel indicators tell you where the breakout level is. This one tells you how far away from it you are, right now, in a form you can act on.
PRO SCREENER
Take control of your trading performance with the Pro Dashboard Screener Designed for serious traders, this utility provides a clean, professional, and real-time overview of your account's health directly on your chart.