 MetaTrader 5
 Experts
 Indicators
 Scripts
 Libraries
 Storage
Join our fan page

Footprint XRay (Order Flow Volume Delta) - indicator for MetaTrader 5

- Views:
- 4910
- Rating:
- Published:
- Updated:
-
 You are missing trading opportunities:
- Free trading apps
- Over 8,000 signals for copying
- Economic news for exploring financial markets
Registration Log inYou agree to website policy and terms of use
If you do not have an account, please register -
 Need a robot or indicator based on this code? Order it on Freelance
Go to Freelance
Need a robot or indicator based on this code? Order it on Freelance
Go to Freelance
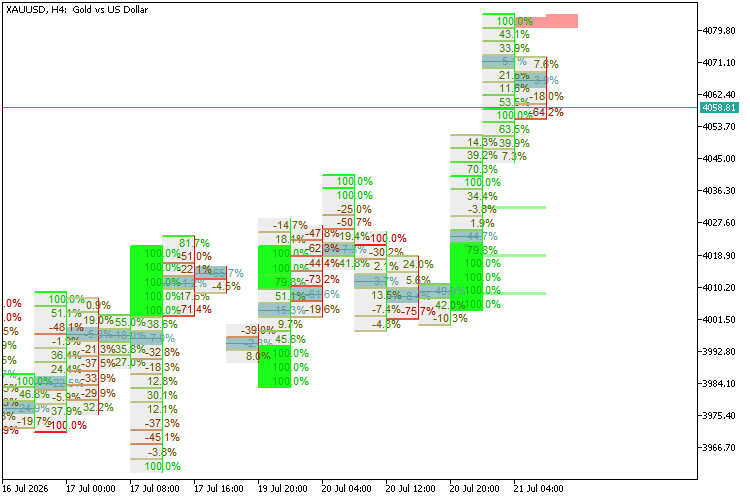
An institutional-grade order flow and footprint chart indicator ported from Pine Script to MQL5.
It dynamically deconstructs major timeframe bars using lower timeframe (LTF) historical tick/real volume to compute buy/sell volume delta at each price level.
The indicator features automatic timeframe selection, Point of Control (POC) highlighting, Stacked Imbalances.
extreme Absorption detection, Unfinished Business (UB) tracking with live mitigation, and real-time alert triggers.
Key Features:
-
Dynamic Column Widths: Footprint cells automatically adjust their horizontal dimensions based on MT5's visual chart zoom scale to maintain separation.
-
Auto-Scaling Font Engine: Text font sizes scale down automatically on smaller zooms and cleanly hide when zoomed out past readability.
-
Background Candle Toggle: hide original background candles to render a clean order-flow layout, with safe visual restoration when the indicator is removed.
-
Performance Optimized: Restricts calculation to a user-defined lookback window to prevent CPU overhead and UI freezing.
-
Closed-Bar Alerts: Signals are evaluated on completed bars to prevent tick-by-tick alert spam.
Short Guide for Users
1. Installation
-
Open your MetaTrader 5 terminal.
-
Press F4 to open MetaEditor.
-
In the Navigator tree on the left, right-click the Indicators folder and select New File.
-
Choose Custom Indicator, name it FootPrint_X_Ray, and click Next until finished.
-
Paste the entire compiled .mq5 code into the workspace, replacing all existing code.
-
Click the Compile button at the top.
-
Go back to MetaTrader 5, locate FootPrint_X_Ray under your Navigator's Indicators folder, and drag it onto your chart.
2. Best Practices & Tweaks
-
Hiding Default MT5 Candles: For the clearest visual layout, keep Hide Background Candles set to true.
-
This hides the default bodies so you can focus strictly on the footprint cells.
-
The indicator safely restores your native chart template colors when detached.
-
Adjusting Column Spacing: If the columns appear too thin or fat on your monitor, use the Width Spacing Multiplier parameter.
-
Setting it to 0.80 will compress the boxes slightly, while 1.20 will expand them.
-
Font Legibility: If the numbers are too small or overlapping, adjust the Base Footprint Font Size (defaults to 8).
-
Calculation Limit: The indicator is optimized to draw footprints on the most recent 25 bars by default.
-
f you need a deeper lookback and your terminal has a fast processor, you can increase Max Bars to Render in the inputs.
-
Data Requirements: Make sure your broker provides volume data (either tick or real volume).
-
When loading on a new chart, MT5 may take a moment to download the required lower timeframe historical data (M1/M5) to compute the deltas.
Value Area Levels / BhanuCodeLab
Value Area Levels is a session-based Value Area indicator for MetaTrader 5. It calculates and displays Value Area High, Point of Control, and Value Area Low levels for the developing, previous, and historical profiles.
 Interactive Supply and Demand Zone Trading Prototype
This release introduces a lightweight automated trading prototype built on top of the Interactive Supply and Demand Zone Manager framework. The framework allows traders to draw and manage their own supply and demand zones, while each zone maintains its own lifecycle, interaction history, and evolving state as market conditions change. The hybrid approach combines user-defined zones with automated monitoring, validation, and trade management. The strategy evaluates qualified zones through a structured decision process before generating trade actions. Detailed logging provides visibility into zone behaviour, allowing traders to study interactions and build their own approaches using the collected information.
EA Money Management
A simple indicator based on trend criteria
Asian Session Breakout / BhanuCodeLab
Asian Session Breakout identifies the price range formed during the Asian trading session and monitors how price behaves after that session ends. The Asian High and Asian Low remain extended until the end of the broker trading day. This makes the range useful as an intraday support-and-resistance zone during the European and US sessions. A compact dashboard displays the current range values, configured session time, breakout status, breakout confirmation method, and confirmation timeframe. The indicator does not open or manage trades. It provides market structure and breakout information for discretionary trading or EA development.