 MetaTrader 5
 Experts
 Indicators
 Scripts
 Libraries
 Storage
Join our fan page

Pivot SuperTrend / BhanuCodeLab - indicator for MetaTrader 5

- Views:
- 5341
- Rating:
- Published:
- Updated:
-
 You are missing trading opportunities:
- Free trading apps
- Over 8,000 signals for copying
- Economic news for exploring financial markets
Registration Log inYou agree to website policy and terms of use
If you do not have an account, please register -
 Need a robot or indicator based on this code? Order it on Freelance
Go to Freelance
Need a robot or indicator based on this code? Order it on Freelance
Go to Freelance
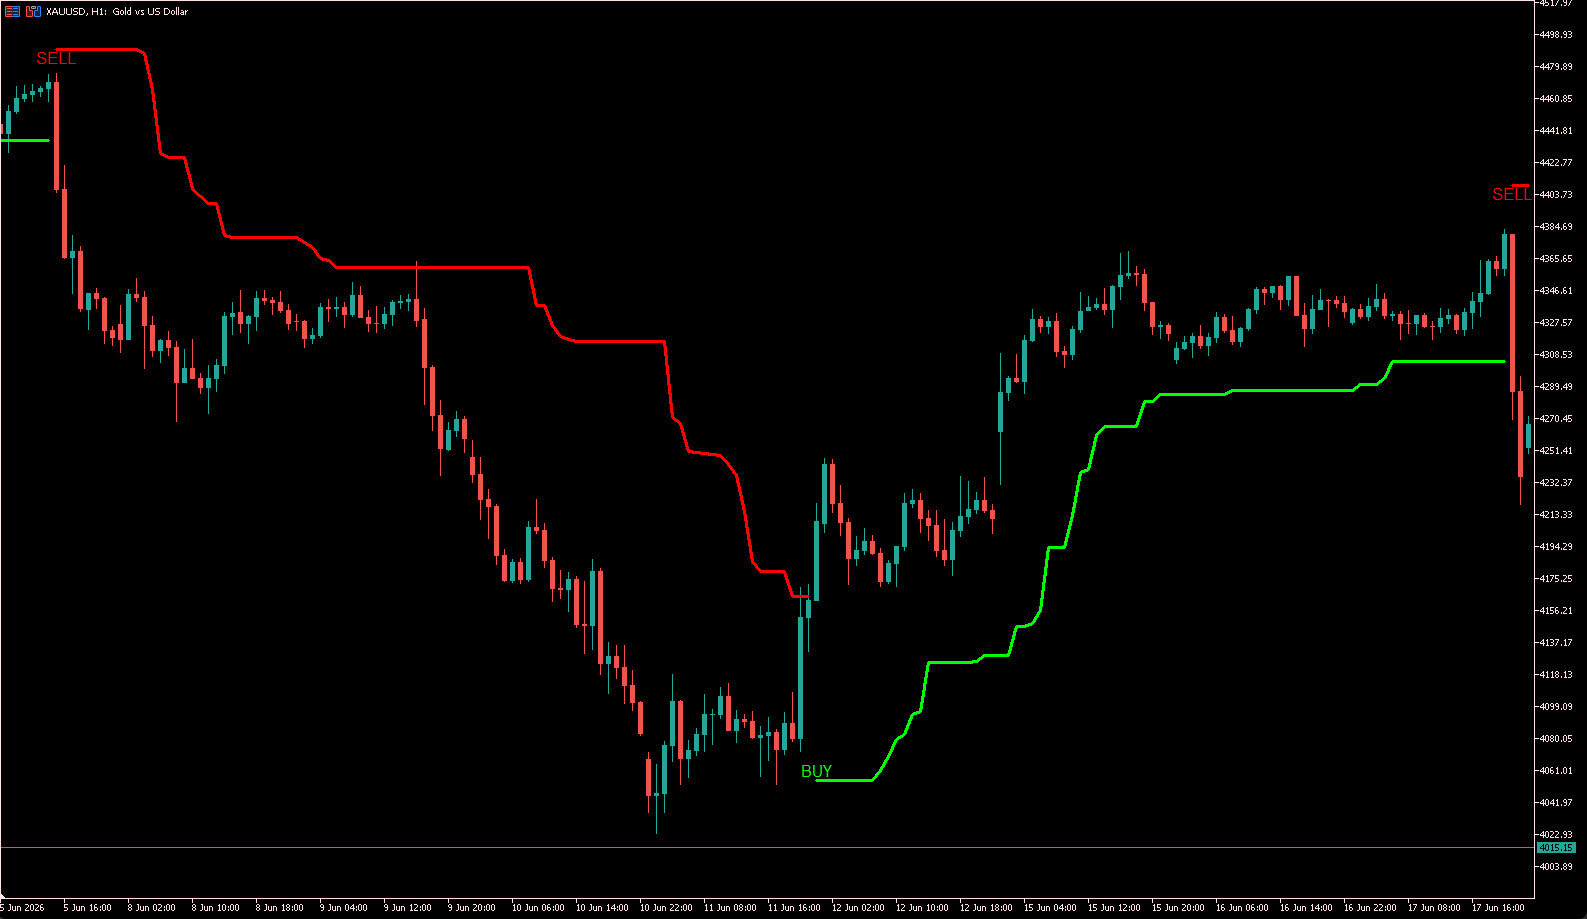
The indicator calculates confirmed swing highs and swing lows, then uses them to build a weighted pivot center. An ATR-based adaptive trail is calculated around this center to determine the current trend direction.
A bullish trend is displayed with the bullish trail color, while a bearish trend is displayed with the bearish trail color. When the trend changes direction, the indicator can display BUY or SELL tags and generate terminal, push, or email notifications.
Optional features include:
- Confirmed swing-high and swing-low markers
- Weighted pivot center line
- Latest confirmed support and resistance levels
- BUY and SELL signal tags
- Closed-candle or live-candle alerts
- EA-accessible signal and trend buffers
Who Is This Indicator For?
This indicator is suitable for:
- Trend-following traders
- Swing traders
- Intraday traders
- Traders looking for structured trend-reversal signals
- Traders who use pivot highs and lows for market structure analysis
- EA developers who need accessible trend and signal buffers
- Traders who want ATR-adjusted signals that respond to changing volatility
It can be used on Forex, metals, indices, cryptocurrencies, and other instruments available in MetaTrader 5.
How to Check the Signals
BUY Signal
A BUY signal appears when the indicator changes from a bearish trend to a bullish trend.
Look for:
- The trail changing to the bullish color
- A BUY tag appearing on the chart
- The Trend Direction buffer changing from -1 to 1
The BUY signal becomes more reliable when confirmed after the candle closes.
SELL Signal
A SELL signal appears when the indicator changes from a bullish trend to a bearish trend.
Look for:
- The trail changing to the bearish color
- A SELL tag appearing on the chart
- The Trend Direction buffer changing from 1 to -1
The SELL signal becomes more reliable when confirmed after the candle closes.
Recommended Signal Confirmation
For safer signal checking:
- Enable closed-bar alerts.
- Wait for the signal candle to close.
- Confirm that price remains on the correct side of the trend trail.
- Check the higher-timeframe trend.
- Avoid taking signals during low-volatility or sideways market conditions.
- Use proper stop-loss and risk-management rules.
The indicator should not be used as a complete trading system by itself. Signals should be confirmed with market structure, support and resistance, volatility, or another suitable trading method.
Recommended Timeframes
The indicator can be used on all MetaTrader 5 timeframes, but it generally performs better on:
- M15 and M30 for intraday trading
- H1 and H4 for swing trading and more stable trend signals
- D1 for long-term trend analysis
For most users, H1 is the best balanced timeframe because it provides clearer trend changes with less market noise.
Lower timeframes such as M1 and M5 may produce more frequent signals, but they can also generate more false reversals during sideways or highly volatile market conditions.
A practical approach is to check the main signal on M15 or H1 and confirm the broader trend using H1 or H4.
 Trading Performance journal
An institutional-grade trading journal and behavioral analytics suite designed to run entirely inside MetaTrader 5. The application is built as a single-file, zero-dependency dashboard that replaces standard terminal objects with a high-performance, double-buffered vector graphics pipeline (CCanvas). It provides real-time quantitative analysis, behavioral risk auditing, a vertical scrollable monthly calendar, and interactive log cards with inline note editing directly on the chart.
Rainbow Ranga - AKM
This indicator is essentially a GPS based on envelope as channel gauging and weather radar for the market wrapped into one. Instead of just giving you a bunch of lines to guess at, it calculates the mathematical "stretch" of the market and combines it with a multi-timeframe trend analysis to tell you exactly where you are. if price is outside band it is some fundamental shift in momentum happening if you are on wrong side then quit and stay away or go with trend on pull backs
SMMA Levels MTF / BhanuCodeLab
SMMA Levels MTF is a multi-timeframe Smoothed Moving Average indicator for MetaTrader 5. The indicator calculates SMMA values from several selectable timeframes and displays them together on the current chart.
Volume Strength Compass / BhanuCodeLab
Volume Strength Compass is a volume-analysis indicator for MetaTrader 5 that evaluates market activity using Relative Volume, candle body strength, close position, and volume intensity. The indicator classifies each candle into different volume conditions such as normal volume, low volume, high volume,climax volume, bullish effort, bearish effort, and absorption. The results are displayed using colored volume columns, background highlights, signal labels, an average-volume line, and a real-time dashboard. The indicator can use tick volume, real volume, or automatically select real volume when available. It also supports alerts on either the current live candle or after candle closure.