 MetaTrader 5
 Experts
 Indicators
 Scripts
 Libraries
 Storage
Join our fan page

SMMA Levels MTF / BhanuCodeLab - indicator for MetaTrader 5

- Views:
- 1411
- Rating:
- Published:
- Updated:
-
 You are missing trading opportunities:
- Free trading apps
- Over 8,000 signals for copying
- Economic news for exploring financial markets
Registration Log inYou agree to website policy and terms of use
If you do not have an account, please register -
 Need a robot or indicator based on this code? Order it on Freelance
Go to Freelance
Need a robot or indicator based on this code? Order it on Freelance
Go to Freelance
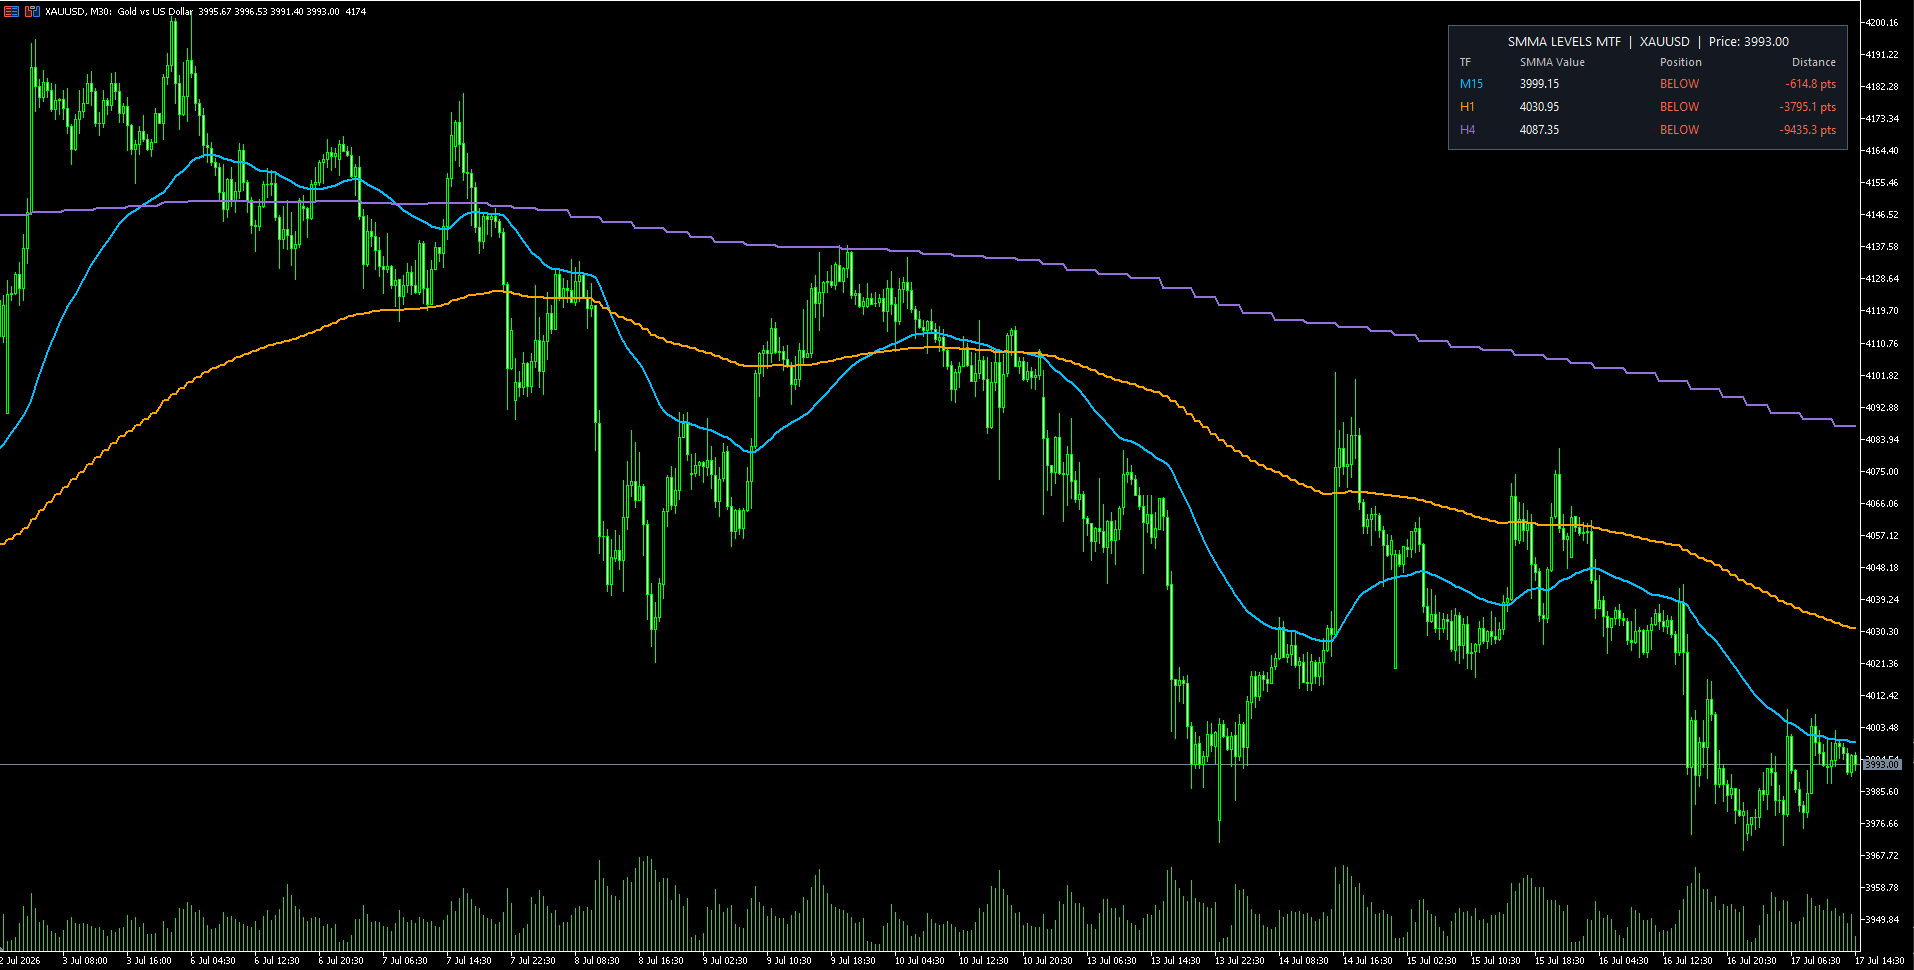
Importance of the Indicator
A single moving average only shows the trend condition of one timeframe. This can be misleading when the lower timeframe is bullish while the broader market trend remains bearish.
This indicator helps traders see the relationship between several market timeframes at the same time.
For example:
- Price above the M15, H1, and H4 SMMAs may indicate broad bullish alignment.
- Price below all three levels may indicate broad bearish alignment.
- Price above the lower-timeframe SMMA but below the higher-timeframe levels may indicate a temporary pullback rather than a complete trend reversal.
- A large distance from a higher-timeframe SMMA may indicate that price is extended and could be vulnerable to consolidation or mean reversion.
The distance column also helps traders understand how close price is to an important dynamic support or resistance level.
The indicator does not predict future price movement. It provides structured trend and location information that can support better trade filtering and decision-making.
Who Is This Indicator For?
This indicator can be useful for:
Trend Traders
Trend traders can use the dashboard to confirm whether several timeframes support the same market direction before entering a trade.
Multi-Timeframe Traders
Traders who normally switch between M15, H1, H4, or other charts can monitor selected SMMA levels from one chart.
Pullback Traders
The SMMA levels can act as dynamic trend references. Traders may watch for price reactions, pullbacks, or continuation setups near these levels.
Intraday Traders
Scalpers and day traders can use lower-timeframe SMMAs for immediate market direction while using higher-timeframe SMMAs as broader trend filters.
Swing Traders
Swing traders can monitor higher-timeframe levels such as H1, H4, or D1 to identify the broader market structure and potential dynamic support or resistance.
Beginner Traders
The dashboard simplifies moving-average interpretation by clearly showing ABOVE or BELOW, instead of requiring the trader to manually compare every value.
Expert Advisor Developers
The indicator logic can also serve as a visual reference when testing multi-timeframe trend filters for automated trading systems.
Recommended Use
The indicator is best used as a trend-confirmation and market-context tool. It can be combined with:
- Support and resistance
- Price-action patterns
- Breakout strategies
- Pullback entries
- Market structure
- Momentum indicators
- Risk-management rules
It should not be treated as a complete standalone trading strategy or as a guaranteed buy-and-sell signal system.
Pivot SuperTrend / BhanuCodeLab
Pivot SuperTrend BhanuCodeLab is a trend-following indicator that combines confirmed pivot points with an ATR-based trailing trend line to identify market direction, trend reversals, and potential BUY or SELL signals.
 Trading Performance journal
An institutional-grade trading journal and behavioral analytics suite designed to run entirely inside MetaTrader 5. The application is built as a single-file, zero-dependency dashboard that replaces standard terminal objects with a high-performance, double-buffered vector graphics pipeline (CCanvas). It provides real-time quantitative analysis, behavioral risk auditing, a vertical scrollable monthly calendar, and interactive log cards with inline note editing directly on the chart.
Volume Strength Compass / BhanuCodeLab
Volume Strength Compass is a volume-analysis indicator for MetaTrader 5 that evaluates market activity using Relative Volume, candle body strength, close position, and volume intensity. The indicator classifies each candle into different volume conditions such as normal volume, low volume, high volume,climax volume, bullish effort, bearish effort, and absorption. The results are displayed using colored volume columns, background highlights, signal labels, an average-volume line, and a real-time dashboard. The indicator can use tick volume, real volume, or automatically select real volume when available. It also supports alerts on either the current live candle or after candle closure.
Portfolio Correlation and Margin Risk Calculator
Computes the historical Pearson correlation between any set of instruments and the combined margin your account would need to hold all of them at once, as a percentage of your equity. Runs natively in MetaTrader 5 with no external libraries, no Python, and no AI — set your symbol list and lot sizes as inputs and it reports the full matrix in the Experts tab and on the chart, refreshing on a timer.