 MetaTrader 5
 Experts
 Indicators
 Scripts
 Libraries
 Storage
Join our fan page

Volume Strength Compass / BhanuCodeLab - indicator for MetaTrader 5

- Views:
- 1916
- Rating:
- Published:
- Updated:
-
 You are missing trading opportunities:
- Free trading apps
- Over 8,000 signals for copying
- Economic news for exploring financial markets
Registration Log inYou agree to website policy and terms of use
If you do not have an account, please register -
 Need a robot or indicator based on this code? Order it on Freelance
Go to Freelance
Need a robot or indicator based on this code? Order it on Freelance
Go to Freelance
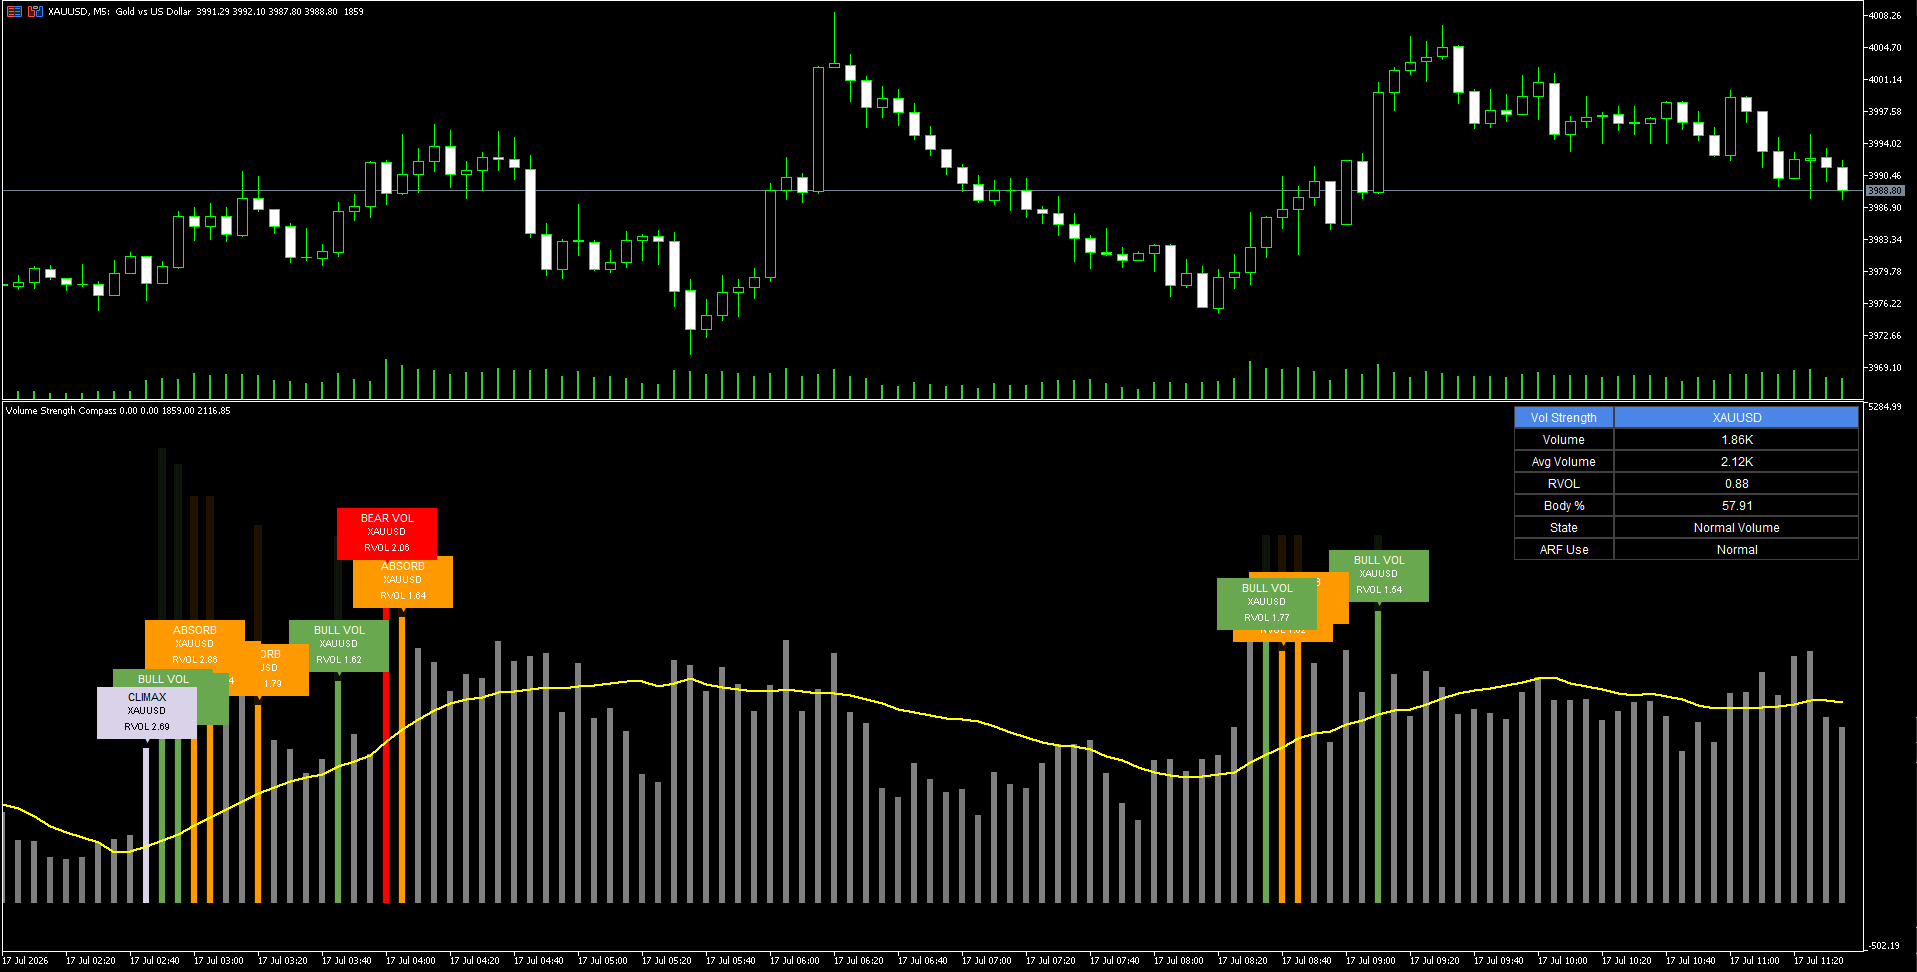
This indicator is used to understand how much market activity is behind each candle and whether that activity produced a meaningful bullish or bearish result.
It helps traders distinguish between:
- normal market activity
- unusually high or low volume
- strong bullish participation
- strong bearish participation
- climax volume
- absorption, where volume is high but price movement is weak
For example, a large bullish candle with high relative volume may indicate genuine buying pressure, while a small candle with very high volume may suggest absorption or a possible turning point.
It is especially helpful for:
- Price-action traders, who want volume confirmation before entering.
- Breakout traders, who want to check whether a breakout has strong participation.
- Reversal traders, who look for climax or absorption near support and resistance.
- Intraday traders and scalpers, who need quick information about current market strength.
- Forex and CFD traders, who mainly use tick volume in MetaTrader.
- Crypto, stock, and futures traders, where real volume may be available.
- Beginner traders, because the dashboard translates raw volume data into simple states such as Bull Good Volume, Bear Good Volume, Climax, or Absorption.
The indicator is best used as a confirmation tool, not as a complete trading strategy by itself. Entries should still be combined with trend direction, support and resistance, market structure, or another entry method.
SMMA Levels MTF / BhanuCodeLab
SMMA Levels MTF is a multi-timeframe Smoothed Moving Average indicator for MetaTrader 5. The indicator calculates SMMA values from several selectable timeframes and displays them together on the current chart.
Pivot SuperTrend / BhanuCodeLab
Pivot SuperTrend BhanuCodeLab is a trend-following indicator that combines confirmed pivot points with an ATR-based trailing trend line to identify market direction, trend reversals, and potential BUY or SELL signals.
Portfolio Correlation and Margin Risk Calculator
Computes the historical Pearson correlation between any set of instruments and the combined margin your account would need to hold all of them at once, as a percentage of your equity. Runs natively in MetaTrader 5 with no external libraries, no Python, and no AI — set your symbol list and lot sizes as inputs and it reports the full matrix in the Experts tab and on the chart, refreshing on a timer.
 Interactive Supply and Demand Zone Trading Prototype
This release introduces a lightweight automated trading prototype built on top of the Interactive Supply and Demand Zone Manager framework. The framework allows traders to draw and manage their own supply and demand zones, while each zone maintains its own lifecycle, interaction history, and evolving state as market conditions change. The hybrid approach combines user-defined zones with automated monitoring, validation, and trade management. The strategy evaluates qualified zones through a structured decision process before generating trade actions. Detailed logging provides visibility into zone behaviour, allowing traders to study interactions and build their own approaches using the collected information.