 MetaTrader 5
 Experts
 Indicators
 Scripts
 Libraries
 Storage
Join our fan page

Profit Loss calendar - indicator for MetaTrader 5

- Views:
- 3988
- Rating:
- Published:
-
 You are missing trading opportunities:
- Free trading apps
- Over 8,000 signals for copying
- Economic news for exploring financial markets
Registration Log inYou agree to website policy and terms of use
If you do not have an account, please register -
 Need a robot or indicator based on this code? Order it on Freelance
Go to Freelance
Need a robot or indicator based on this code? Order it on Freelance
Go to Freelance
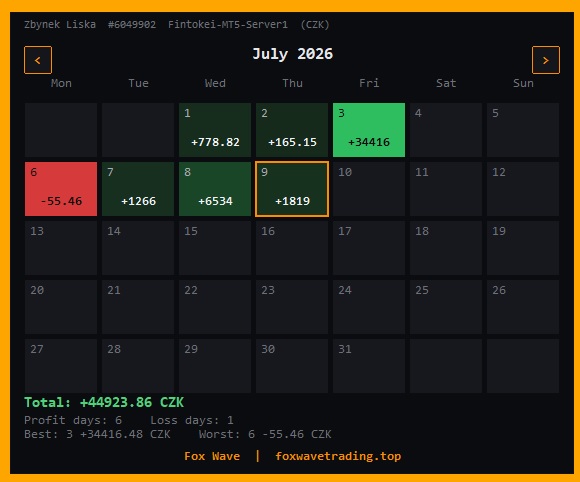
FoxWave P/L Calendar — Monthly Profit & Loss at a Glance
FoxWave P/L Calendar by Fox Wave turns your raw account history into a color-coded monthly calendar, so you can see at a glance which days made money, which days lost, and by how much — without opening a single report.
Key features:
- Full month calendar grid (Mon-Sun) built directly from your account's closed-trade history
- Color-coded daily cells — brighter green for bigger profit days, brighter red for bigger loss days, so the visual intensity itself tells the story
- Automatic currency detection — displays P/L in your account's actual deposit currency (USD, EUR, GBP, CZK, JPY, or any other)
- One-click month navigation — browse back through any previous month or forward again
- Instant summary bar: total P/L for the month, number of profit/loss days, and your single best and worst day
- Today's cell is automatically highlighted so you always know where you are in the month
- Grid automatically resizes to the exact number of weeks a given month needs — no empty rows wasting space
- Optional single-symbol filter, or leave blank to track your whole account across every pair you trade
- Clean dark panel design, fully repositionable, refreshes automatically on a configurable timer
- Lightweight — reads history only periodically, not on every tick, safe to run alongside other tools
Perfect for traders who want a fast, visual read on their monthly consistency — spotting winning streaks, isolating the day a big loss happened, or simply keeping an honest scoreboard of how the month is going.
Chart Navigator MT5 Light
Chart Navigator MT5 Light — a mini-chart for quickly navigating the price chart and instantly jumping to your markers on it
 Stochastic Protector
This Expert Advisor monitors the Stochastic oscillator to automatically close positions based on user-selected conditions: crossovers above overbought or below oversold, entry into overbought/oversold zones, or exit from those zones. Positions are filtered for closure by profit state (loss, profit, or both). An optional Test Mode enables basic entry signals when the %D line crosses configurable offset levels around the midline (50).
Envelope SAR
This indicator is a trend-momentum oscillator that tracks where price sits relative to its structural volatility channel using a normalized relationship between the Parabolic SAR and Envelopes.
T5Copier - MT 5 client to client Local trade copier
A local client to client trade copier with custom dashboard in C# and transport pipe in golang , complete src is provided in archive ( socket based ver ) ultra low latency