 MetaTrader 5
 Experts
 Indicators
 Scripts
 Libraries
 Storage
Join our fan page

Chart Navigator MT5 Light - indicator for MetaTrader 5

I write in mql4 and mql5. In my market you will find a variety of products, every day I develop something new, I research something. New indicators and advisors will appear in the near future.
- Views:
- 4030
- Rating:
- Published:
- Updated:
-
 You are missing trading opportunities:
- Free trading apps
- Over 8,000 signals for copying
- Economic news for exploring financial markets
Registration Log inYou agree to website policy and terms of use
If you do not have an account, please register -
 Need a robot or indicator based on this code? Order it on Freelance
Go to Freelance
Need a robot or indicator based on this code? Order it on Freelance
Go to Freelance
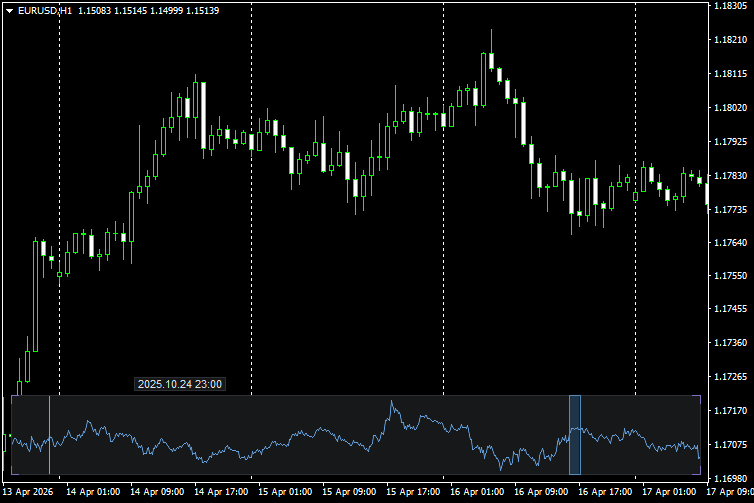
Chart Navigator MT5 Light — a mini-chart for quickly navigating the price chart and jumping straight to your markers on it.
This indicator adds a compact mini-map of the entire price chart to the chart. This map helps you navigate quickly through the history and return to important points marked by vertical lines.
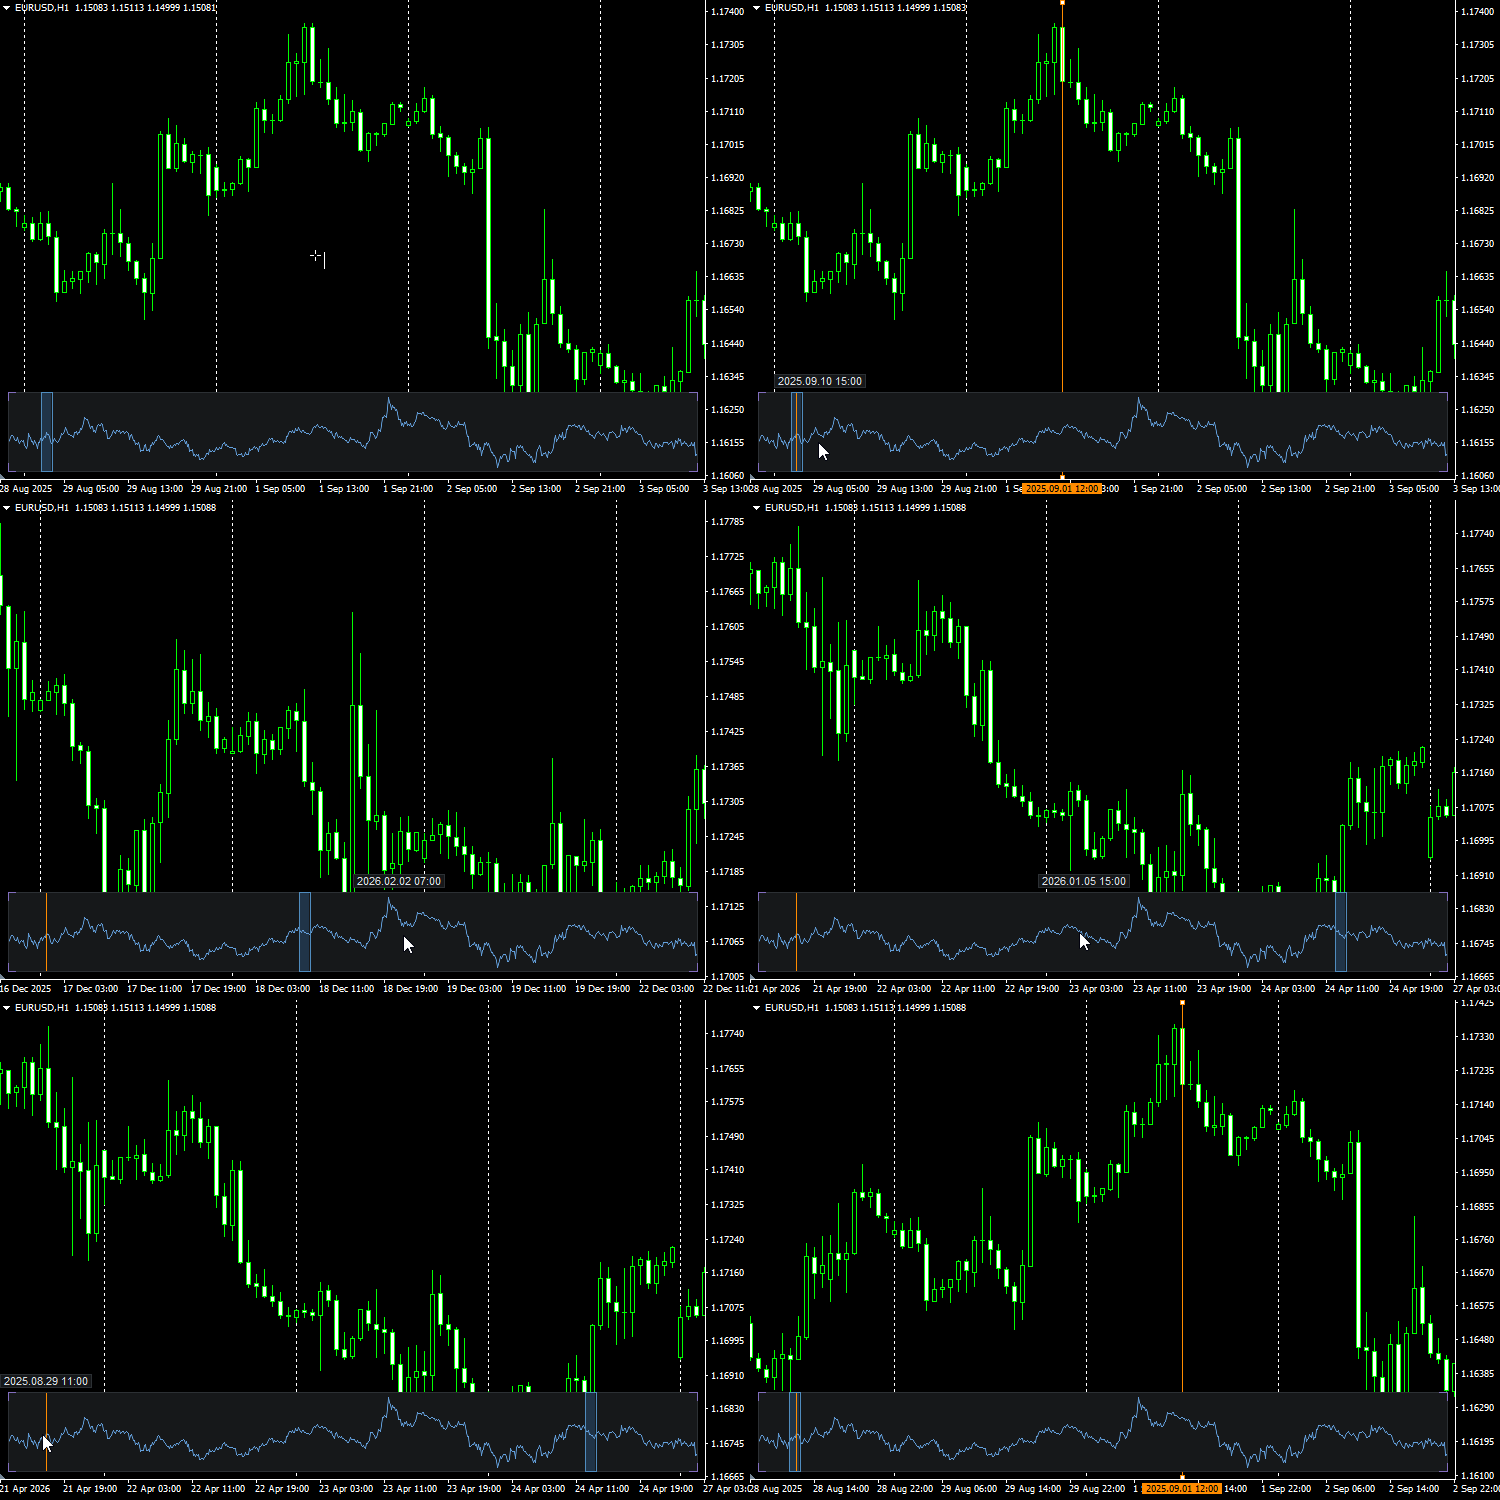
The main benefit of this simple navigator is not scrolling through the chart, but quickly jumping to the required area without the tedious scrolling involved in a manual search. If you place a vertical line on the chart to mark an important event, this line will also be displayed on the mini-map. You can then move far forward or backward through the history, locate the marker on the mini-map and quickly return to the desired point with a single click. This is handy, for example, when you need to mark important dates, signals, trades, news items, analysis zones or any other points you need to return to quickly.
How it works
The mini-chart displays the selected section of the history as a compact price line. The currently visible area of the main chart is highlighted by a frame. Clicking on the mini-chart moves the chart to the selected point, whilst dragging the frame allows you to move quickly through the history.
Vertical lines from the main chart are displayed on the mini-chart as time markers. This allows you to use the mini-chart not only for general navigation, but also as a quick reference to important points on the chart.
Example scenario
-
Place a vertical line at a key point on the chart.
-
Jump far ahead to another part of the history, for example several months or a year ahead.
-
Find this vertical line on the mini-map.
-
Click on the marker on the mini-map.
-
The main chart will immediately jump to the marked point.
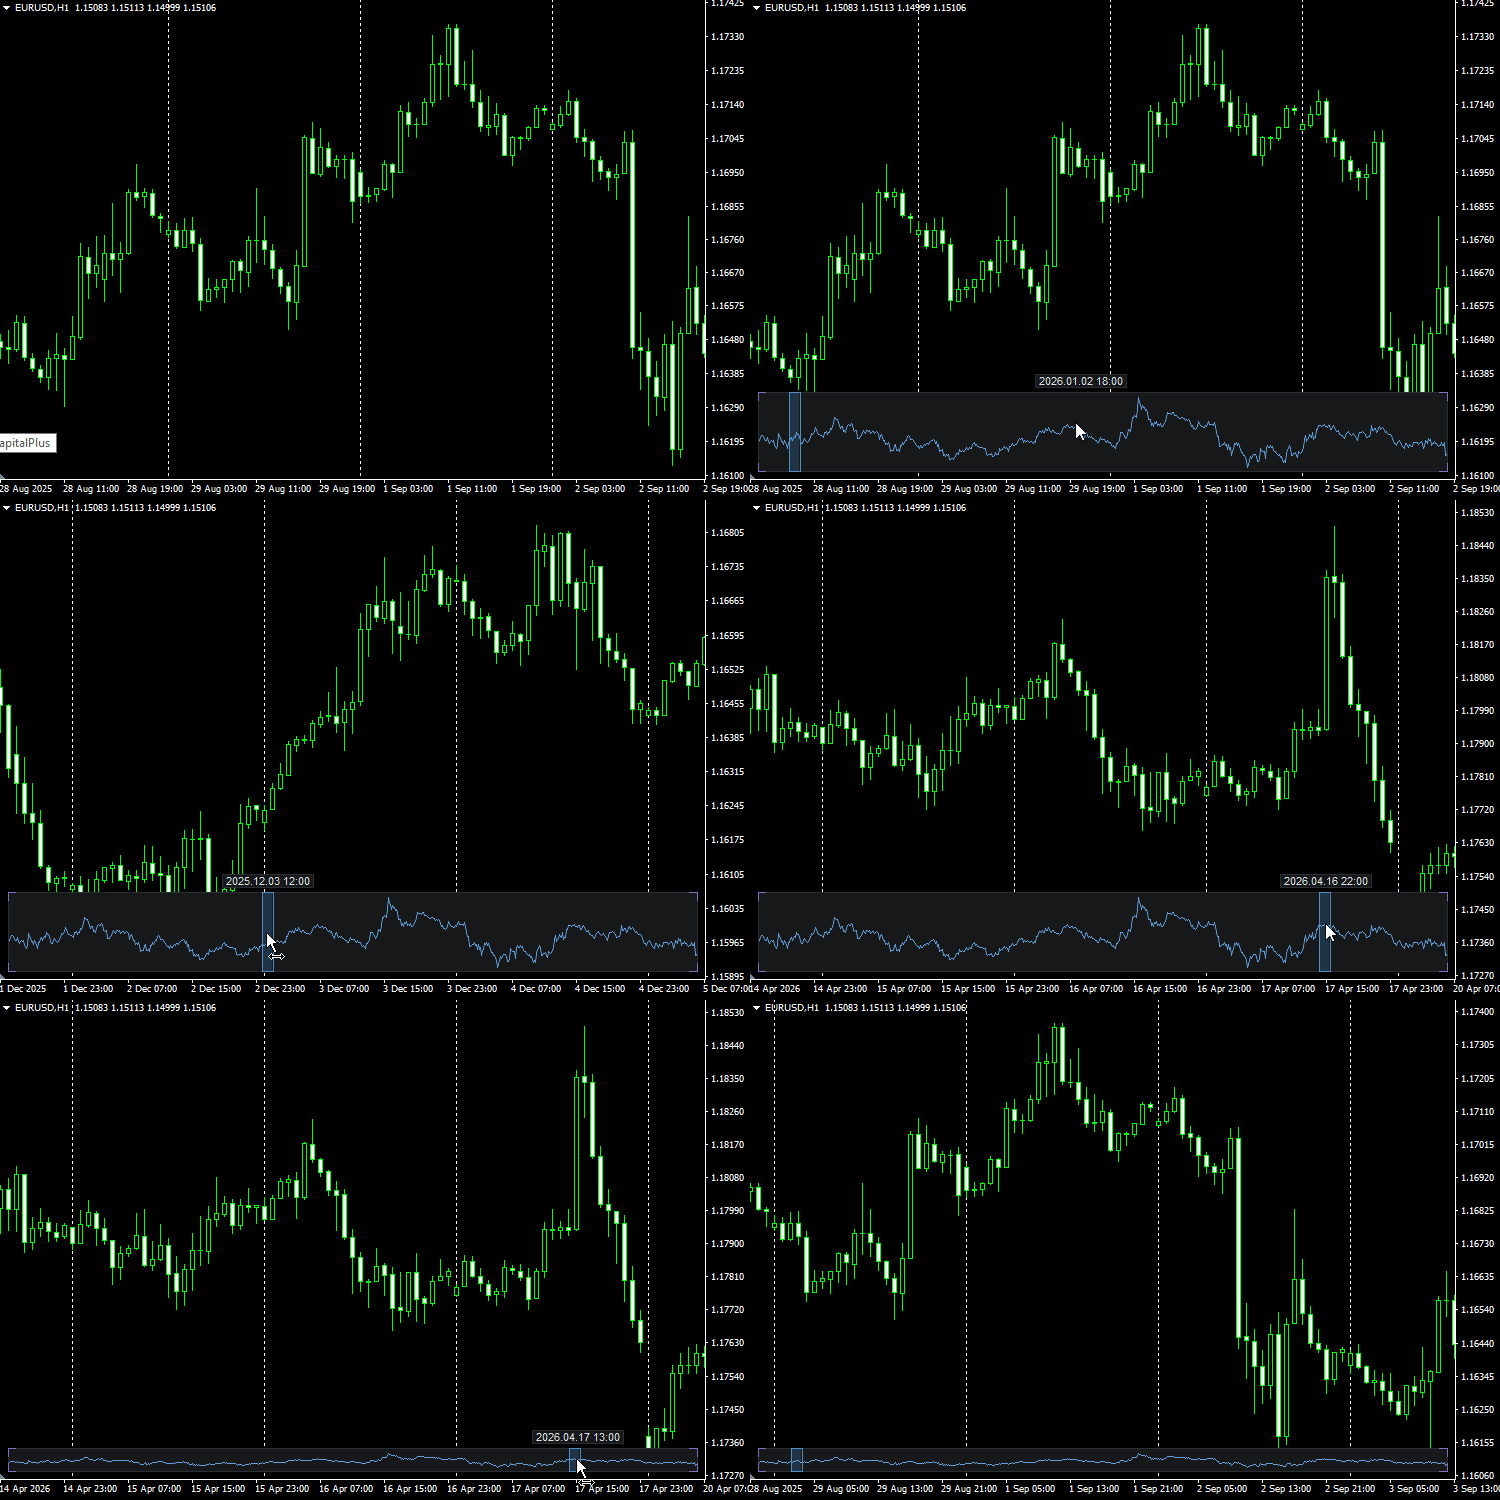
The mini-map can also be scaled down in height and left at the bottom of the chart as a narrow navigation bar. In this form, it takes up almost no space, but remains useful for quick navigation and jumping to markers.
Key features
-
quick navigation through the chart’s history;
-
jump to a selected area by clicking on the mini-map;
-
dragging the frame of the currently visible section;
-
display of vertical lines on the mini-chart;
-
quickly return to important markers on the chart;
-
dynamic date display when hovering over the mini-map;
-
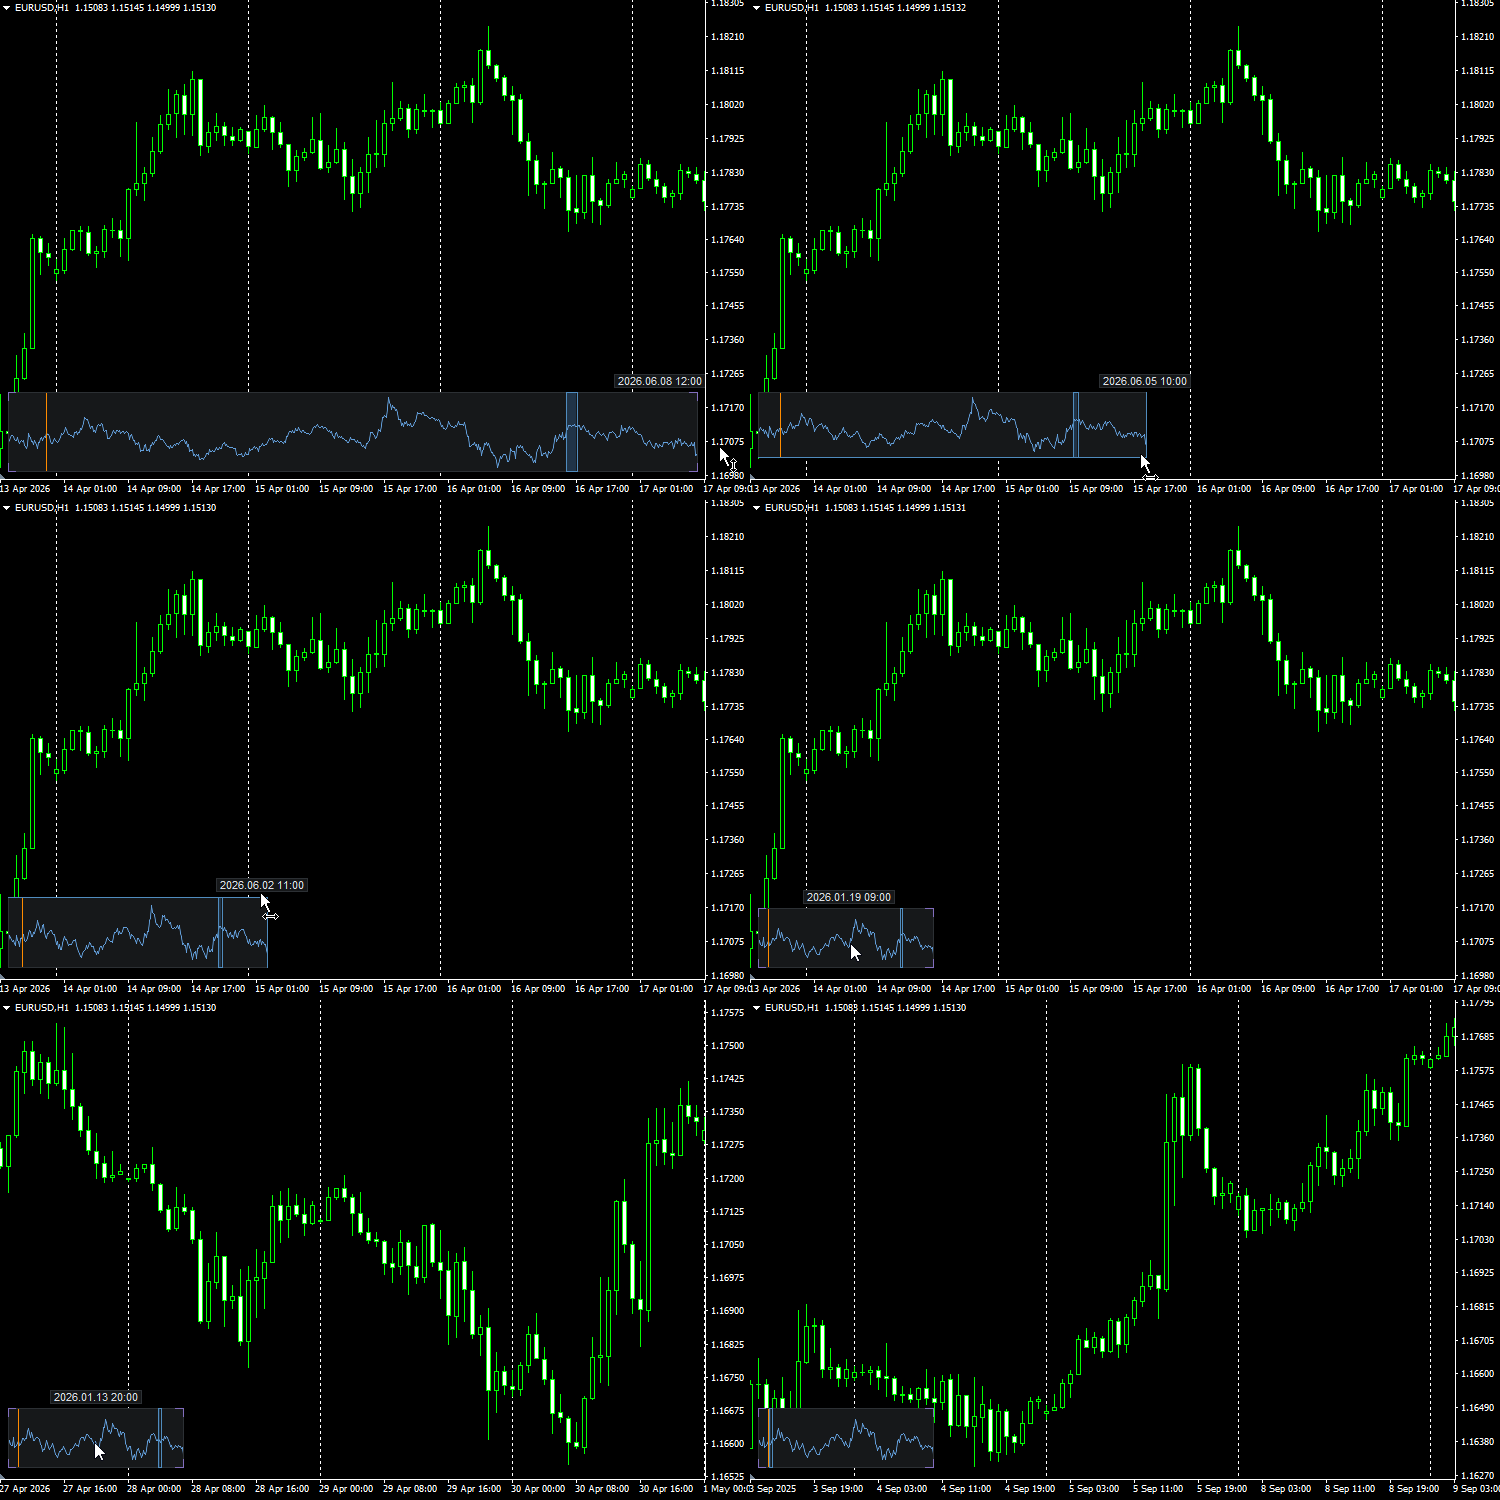
resize the mini-map using the mouse;
-
the option to use the map as a compact bottom navigation bar.
Date settings
In the indicator, you can set the start date for the mini-chart. This is useful if you do not need to display the instrument’s entire available history, but only need to work with the current period. You can also enable the end date for the range. By default, this is disabled, but the date value itself is retained in the settings so that it can be quickly enabled if necessary.
The dynamic date above the mini-chart, which tracks the cursor’s position on it, helps you understand more precisely which part of the history the section of the mini-chart corresponds to.
Technical features
The mini-chart is rendered using a canvas. The indicator does not trade, does not send trade requests, does not use DLLs, does not access external services and does not save data to files.
Note
Chart Navigator MT5 Light is not a trading signal; it does not analyse the market or make trading decisions. Its purpose is to speed up work with long historical data and help you quickly locate marked points on the chart.
There is also a professional version of this indicator with advanced functionality.
Translated from Russian by MetaQuotes Ltd.
Original code: https://www.mql5.com/ru/code/73795
 Stochastic Protector
This Expert Advisor monitors the Stochastic oscillator to automatically close positions based on user-selected conditions: crossovers above overbought or below oversold, entry into overbought/oversold zones, or exit from those zones. Positions are filtered for closure by profit state (loss, profit, or both). An optional Test Mode enables basic entry signals when the %D line crosses configurable offset levels around the midline (50).
BBandsPsar
BBandsPsar is a custom hybrid indicator that fuses Bollinger Bands’ volatility framework with the Parabolic SAR’s trend-following logic. By integrating these two methodologies, it effectively reconciles market volatility with emerging trend dynamics within a single, cohesive tool.
Profit Loss calendar
P/L Calendar — Monthly Profit & Loss at a Glance. P/L Calendar shows you, day by day, exactly how your account performed this month — so you can spot your best and worst days, track your win rate, and see your trading rhythm without digging through the terminal's history tab.
Envelope SAR
This indicator is a trend-momentum oscillator that tracks where price sits relative to its structural volatility channel using a normalized relationship between the Parabolic SAR and Envelopes.