 MetaTrader 5
 Experts
 Indicators
 Scripts
 Libraries
 Storage
Join our fan page

Envelope SAR - indicator for MetaTrader 5

- Views:
- 3731
- Rating:
- Published:
- Updated:
-
 You are missing trading opportunities:
- Free trading apps
- Over 8,000 signals for copying
- Economic news for exploring financial markets
Registration Log inYou agree to website policy and terms of use
If you do not have an account, please register -
 Need a robot or indicator based on this code? Order it on Freelance
Go to Freelance
Need a robot or indicator based on this code? Order it on Freelance
Go to Freelance
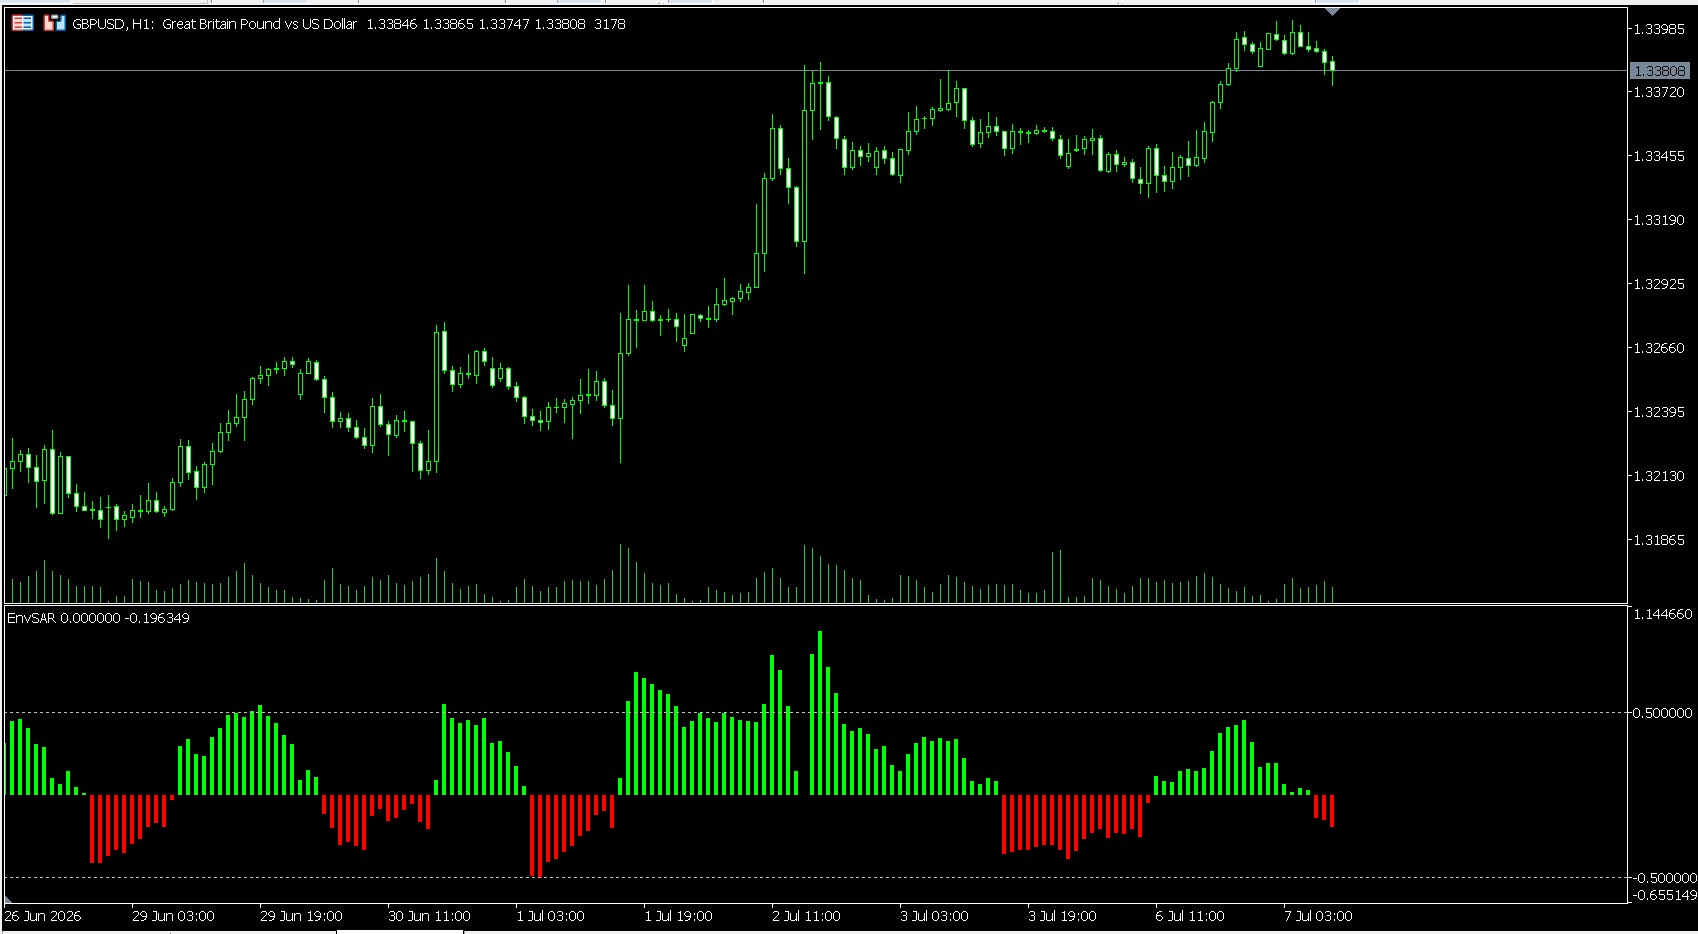
Here is exactly how it works and how to read it:The Core ConceptInstead of plotting lines directly on your price chart, this indicator calculates the distance between the current candle and the Parabolic SAR dot.
It then normalizes that distance by dividing it by the total width of the Envelope channel.$$Level = \frac{\text{Price} - \text{SAR}}{\text{Envelope Upper} - \text{Envelope Lower}}$$By using the Envelope width as a divisor, the indicator scales itself automatically. A value of 1.0 or -1.0 means the distance between price and the SAR is exactly equal to the total height of your Envelope channel.
How to Read the HistogramLime Bars (UpLevel / Bullish Momentum): Appears when the minimum of the open/close price is above the Parabolic SAR.
Higher green bars indicate aggressive upward acceleration, showing that price is rapidly pulling away from its trailing stop.Red Bars (DownLevel / Bearish Momentum): Appears when the maximum of the open/close price is below the Parabolic SAR. Deeper red bars mean strong downward momentum as price drops heavily below the trailing stop.
The Gaps / Blanks: When the Parabolic SAR flips or sits directly inside the body of the candle (violating the upLevel > 0 or downLevel < 0 conditions), the histogram will print an empty value, signaling a structural trend pivot or extreme market consolidation.What it is Best ForMeasuring Trend Strength: Instead of just knowing if the trend is up or down, the fixed grid lines (0.5, 1.5, 2.5) allow you to see if the trend is accelerating or dying out.Filtering False Breakouts: If price breaks out but the histogram fails to cross key structural levels (like 0.5), it warns you of a weak move.
Profit Loss calendar
P/L Calendar — Monthly Profit & Loss at a Glance. P/L Calendar shows you, day by day, exactly how your account performed this month — so you can spot your best and worst days, track your win rate, and see your trading rhythm without digging through the terminal's history tab.
Chart Navigator MT5 Light
Chart Navigator MT5 Light — a mini-chart for quickly navigating the price chart and instantly jumping to your markers on it
 T5Copier - MT 5 client to client Local trade copier
A local client to client trade copier with custom dashboard in C# and transport pipe in golang , complete src is provided in archive ( socket based ver ) ultra low latency
MA + Envelope Breakouts
Breakouts based on envelope channel or band, multi EA logic in One EA