Watch how to download trading robots for free
Find us on Facebook!
Join our fan page
Join our fan page
You liked the script? Try it in the MetaTrader 5 terminal
- Views:
- 14004
- Rating:
- Published:
-
Need a robot or indicator based on this code? Order it on Freelance Go to Freelance
Author: mandorr
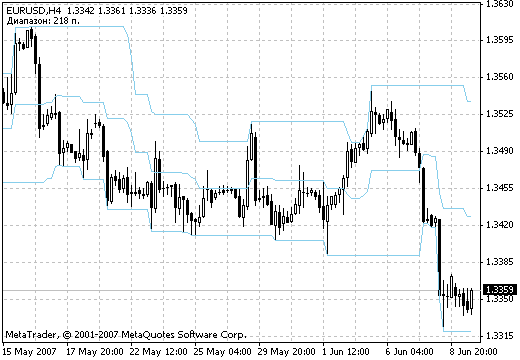
The indicator displays the ranges. Useful for the visualization of various "zones".

The indicator displays the ranges. Useful for the visualization of various "zones".

Translated from Russian by MetaQuotes Ltd.
Original code: https://www.mql5.com/ru/code/7136
 DayImpuls
Simple indicator with great potential for the analysis of data and its use.
 Custom MACD
Displays the difference between the long-term and short-term market sentiments relative to the price.
 Divergence
Displays the situation when the directions of price movement and technical indicators do not coincide. This is mostly seen when the indicator reaches an overbought or oversold area (20;80).
 3end
3end
Shows when to buy and when to sell. Position is opened when the indicator color changes: if there is a green dot - buy, if there is a red dot - sell.