Watch how to download trading robots for free
Find us on Facebook!
Join our fan page
Join our fan page
You liked the script? Try it in the MetaTrader 5 terminal
- Views:
- 11025
- Rating:
- Published:
- Updated:
-
 You are missing trading opportunities:
- Free trading apps
- Over 8,000 signals for copying
- Economic news for exploring financial markets
Registration Log inYou agree to website policy and terms of use
If you do not have an account, please register -
 Need a robot or indicator based on this code? Order it on Freelance
Go to Freelance
Need a robot or indicator based on this code? Order it on Freelance
Go to Freelance
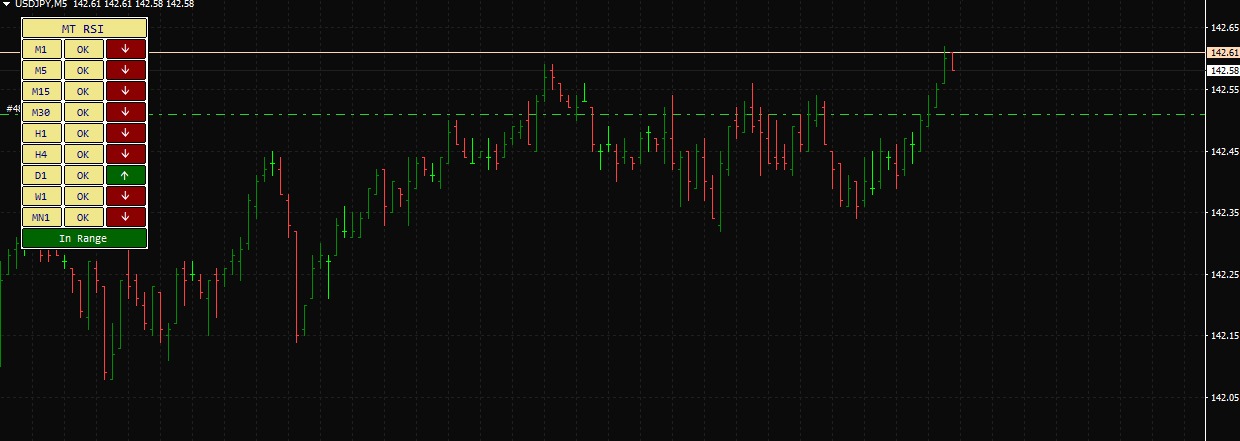
A powerful multi-timeframe RSI dashboard that visually displays the overbought, oversold, and neutral RSI status across 9 different timeframes — from M1 to MN1.
Key Features
-
RSI readings across M1 to MN1 in one view
-
Color-coded status: Overbought, Oversold, In Range
-
Works on any chart or symbol
 EA Stochastic Bollinger Bands Multi - Timeframe
This MQL4 code implements an Expert Advisor (EA) that trades based on the Stochastic Oscillator and Bollinger Bands indicators across multiple timeframes (M1, M5, and M15).
 Fair Value Gaps
Fair Value Gaps indicator or 'imbalance areas' where markets often move back to.
Range Breakout Indicator - Indicator Buffer Only
This indicator for Breakout Strategy. It doesn't print objects on the chart.
BBMA - Bollinger Band Moving Average
All indicators required by BBMA Strategy in a single indicator.