Watch how to download trading robots for free
Find us on Twitter!
Join our fan page
Join our fan page
You liked the script? Try it in the MetaTrader 5 terminal
- Views:
- 10783
- Rating:
- Published:
-
Need a robot or indicator based on this code? Order it on Freelance Go to Freelance
Indicator
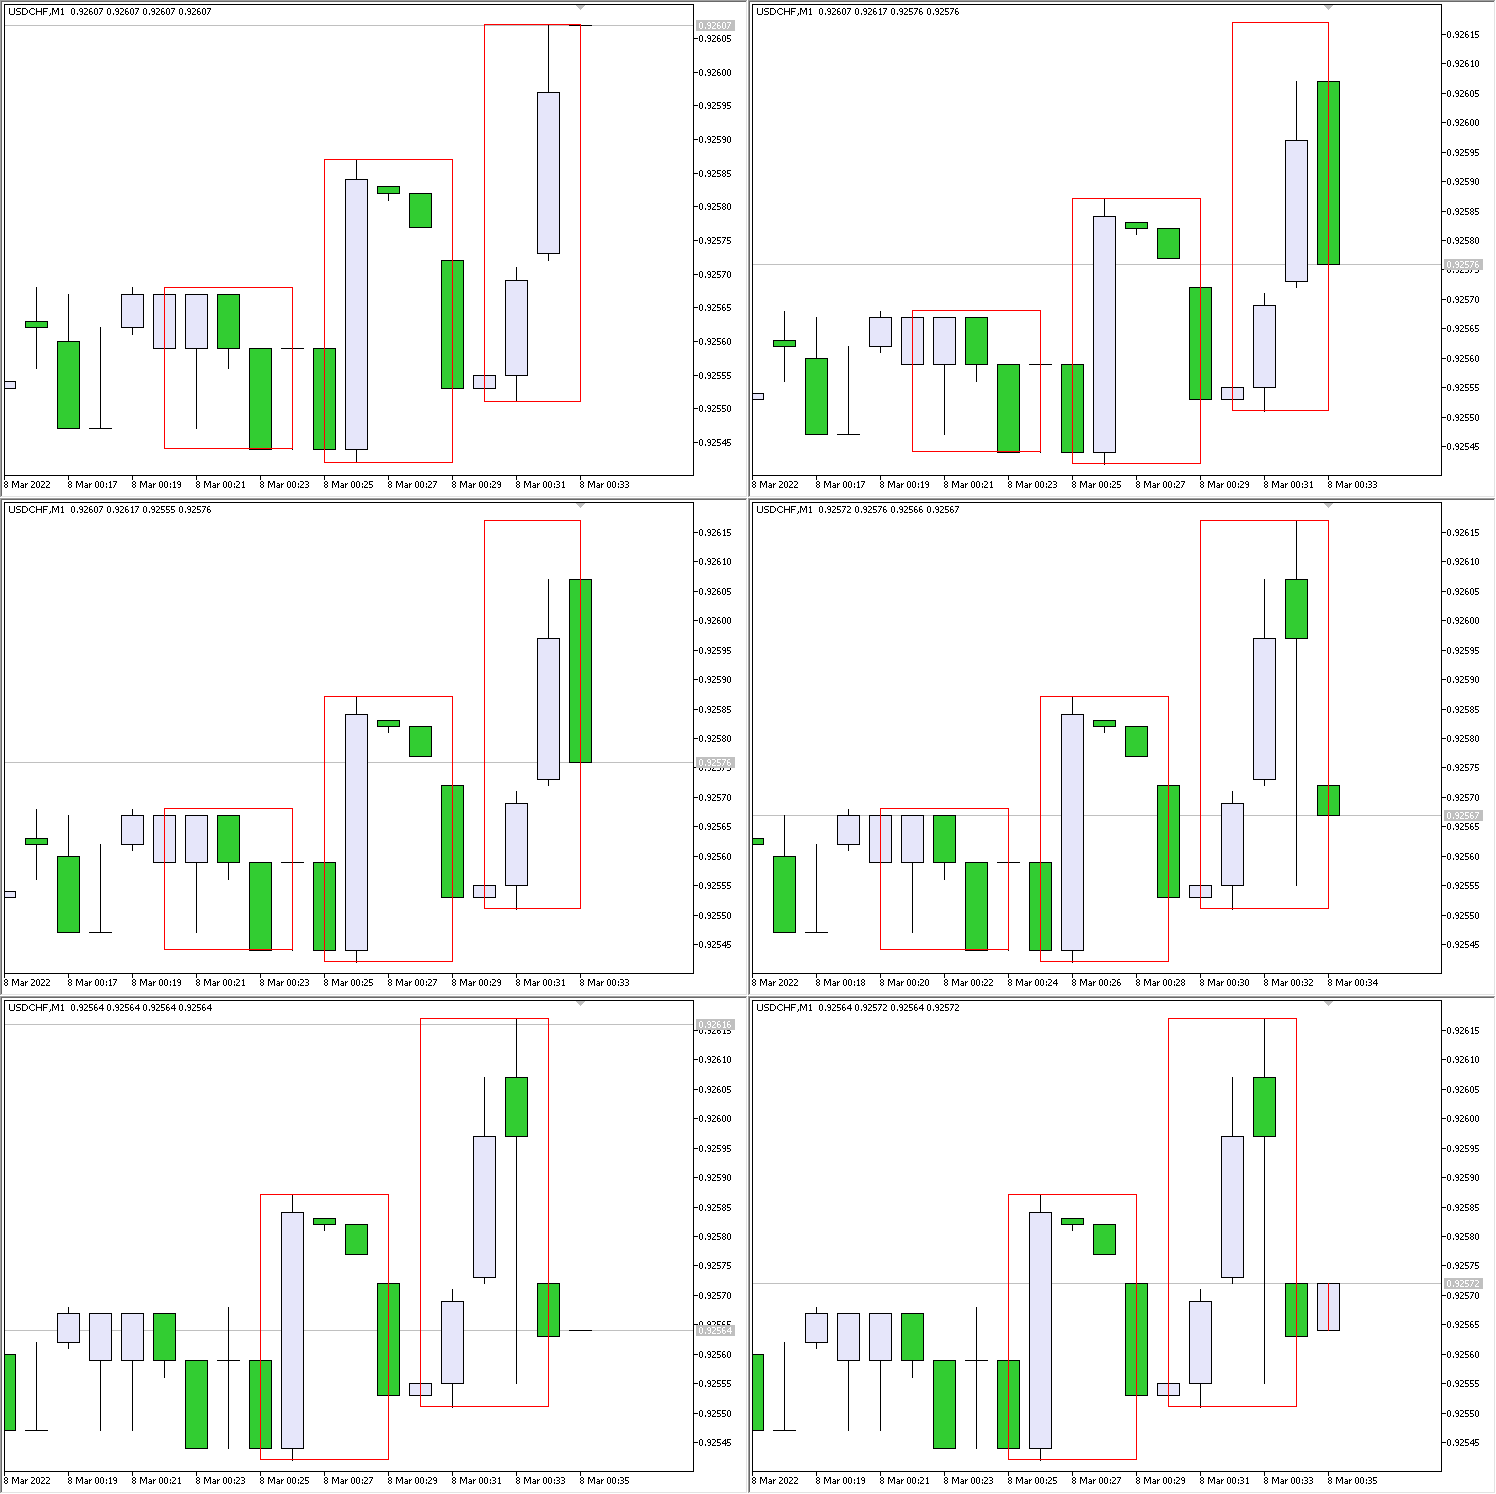
The task of the indicator is to visualize the last three candles from another (larger) timeframe.
With the help of OBJ_RECTANGLE graphical objects, the last three candlesticks are drawn - rectangles are built at High and Low prices.

Rice. 1. Three Candles Other TimeFrame
 MA on RMI
Smoothing the custom indicator 'Relative Momentum Index' using iMA
 Two MA Color N Bars Square
Two indicator series ('Two MA Color N Bars' and 'Square') in one code
 OsMA Four Colors Arrow EA
Trading strategy for the custom indicator 'OsMA Four Colors Arrow EA'
 Economic Calendar Data Aggregator
Service Script for aggregating Economic Calendar data to a .txt file