Join our fan page

- Views:
- 9072
- Rating:
- Published:
-
 You are missing trading opportunities:
- Free trading apps
- Over 8,000 signals for copying
- Economic news for exploring financial markets
Registration Log inYou agree to website policy and terms of use
If you do not have an account, please register -
 Need a robot or indicator based on this code? Order it on Freelance
Go to Freelance
Need a robot or indicator based on this code? Order it on Freelance
Go to Freelance
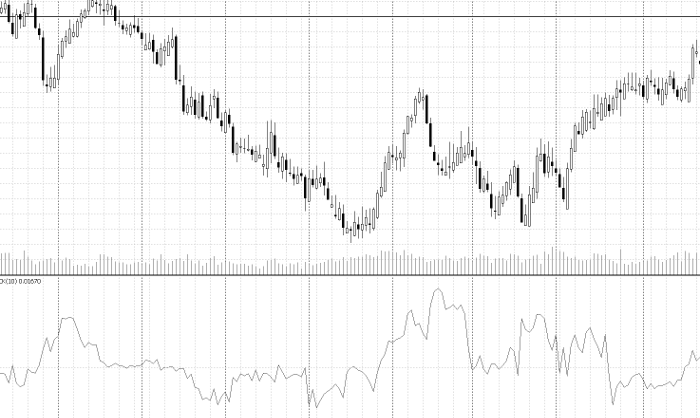
A simple indicator that tries to assess autocorrelation in price series.
- Values above 0 indicate autocorrelation between return and therefore a strong direction in movement (which could denote the begin of a trend or a chance for reversal).
- Values below 0 indicate periods of uncertanty (which could denote the end of trends/reversals).
- Values close to 0 indicate regions similar to random walks, and therefore not particular interesting.
The indicator is supposed to be used as support for other indicators as it does not present the user with trade direction.
Good Profits!
 MACD Stochastic Square
A series of indicators 'Square' - shows the state of the indicators in the form of lines of squares. Displays two indicators: MACD and Stochactic
 DeMarker Pending 2_5
Finalization of previous version. Now, when opening a 'SELL' position, we immediately close all 'BUY' positions and vice versa: when opening a 'BUY' position, we immediately close all 'SELL' positions
Triangle Day
The indicator plots (using OBJ_TRIANGLE) the area between 'Open', 'High', 'Low' and 'Close' of the day
VIDYA N Bars Borders Martingale
Martingale based on custom indicator 'VIDYA N Bars Borders'