Join our fan page
- Published by:
- Views:
- 14906
- Rating:
- Published:
- Updated:
-
 You are missing trading opportunities:
- Free trading apps
- Over 8,000 signals for copying
- Economic news for exploring financial markets
Registration Log inYou agree to website policy and terms of use
If you do not have an account, please register -
 Need a robot or indicator based on this code? Order it on Freelance
Go to Freelance
Need a robot or indicator based on this code? Order it on Freelance
Go to Freelance
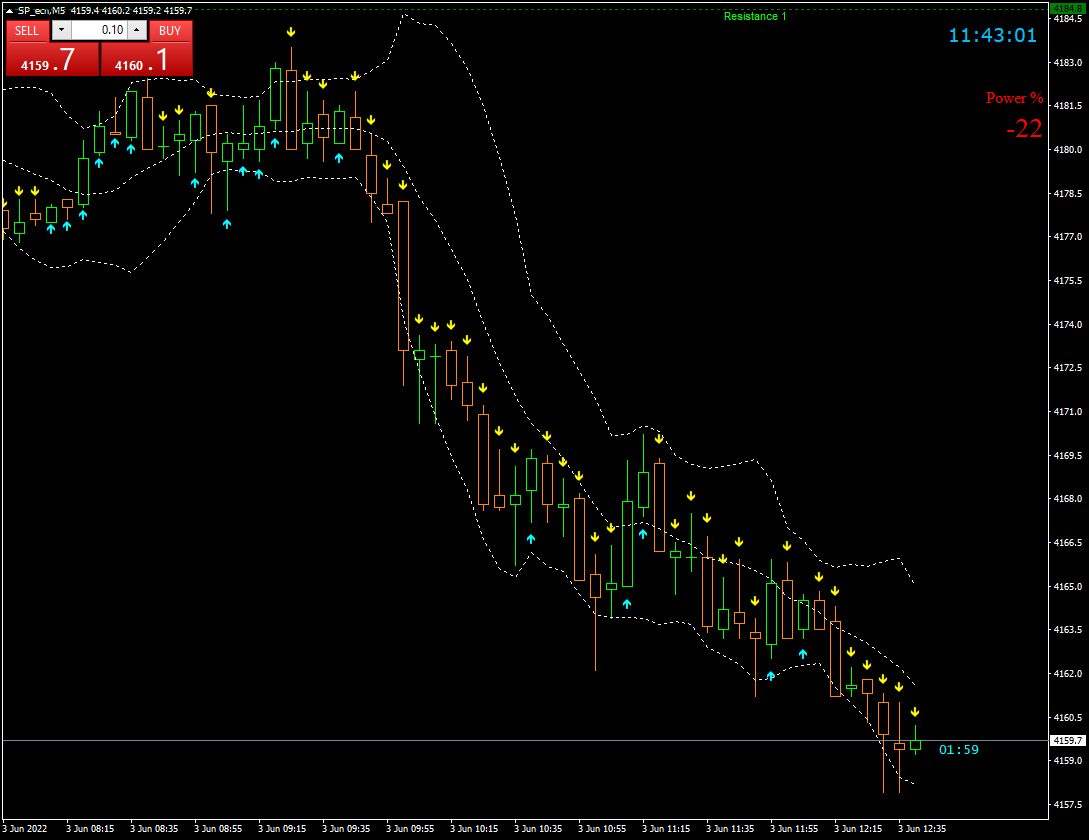
Arrow Up and Down on each bar and informations about "power of trend" and about "PEAK" or "EXTREM peak" on the chart.
Indicator uses only WPR and RSI signals. Arrows can be changed only on last bar and indicator can be used on all TF and all symbols.
Princip is simle ((WPR(4) +100 + RSI(2))/2) < or > 50. This is my first indicator, be carefull and good luck.
On chart are used another 4 indicators: BollingerBands (9,2,0), Clock, FiboPiv_v2, PL4 CandleTime
 ScalpX
ScalpX is an indicator that uses Kalman filters to identify buy and sell opportunities whenever is indicated by the graph.
Market High and Lows
This indicator shows market highs and lows for any timeframe with period separators. You can see daily/weekly/monthly highs/lows on lower timeframes like H1/M30/M40. This is good for trading breakouts.
R-Squard and Linear Regression
a procedure that calculate most stats in one call: R-Squared and Linear Regression
Speed and Acceleration (with HMA)
This indicator gives the Speed and Acceleration of the price for a given period. In order to make a smooth graph, can be used a procedure using the Hull Moving Average method