Watch how to download trading robots for free
Find us on Telegram!
Join our fan page
Join our fan page
You liked the script? Try it in the MetaTrader 5 terminal

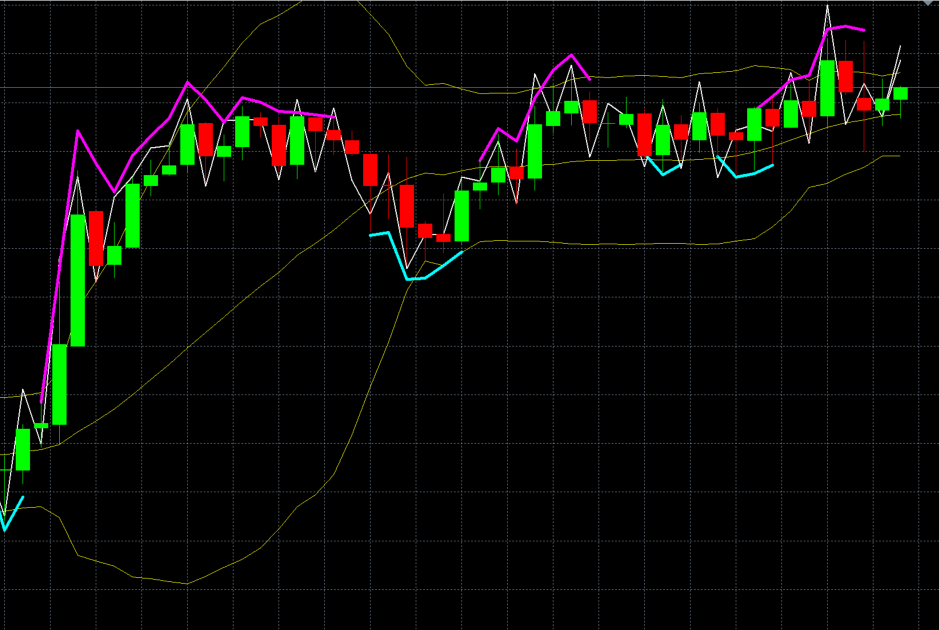
ScalpX - indicator for MetaTrader 4

- Views:
- 25207
- Rating:
- Published:
-
 You are missing trading opportunities:
- Free trading apps
- Over 8,000 signals for copying
- Economic news for exploring financial markets
Registration Log inYou agree to website policy and terms of use
If you do not have an account, please register -
 Need a robot or indicator based on this code? Order it on Freelance
Go to Freelance
Need a robot or indicator based on this code? Order it on Freelance
Go to Freelance
ScalpX is an indicator that uses Kalman filters to identify buy and sell opportunities whenever is indicated by the graph.
Market High and Lows
This indicator shows market highs and lows for any timeframe with period separators. You can see daily/weekly/monthly highs/lows on lower timeframes like H1/M30/M40. This is good for trading breakouts.
Kalman Speed oscillator
Kalman Speed oscillator... Just an experiment
LP_entry
Arrow Up and Down on each bar and other informations.
R-Squard and Linear Regression
a procedure that calculate most stats in one call: R-Squared and Linear Regression