Watch how to download trading robots for free
Find us on Twitter!
Join our fan page
Join our fan page
You liked the script? Try it in the MetaTrader 5 terminal
- Published by:
-
padbravo
 Developer for simple (non AI) robots for trading and indicators... most used: MT4
 - Views:
- 9999
- Rating:
- Published:
-
 You are missing trading opportunities:
- Free trading apps
- Over 8,000 signals for copying
- Economic news for exploring financial markets
Registration Log inYou agree to website policy and terms of use
If you do not have an account, please register -
 Need a robot or indicator based on this code? Order it on Freelance
Go to Freelance
Need a robot or indicator based on this code? Order it on Freelance
Go to Freelance
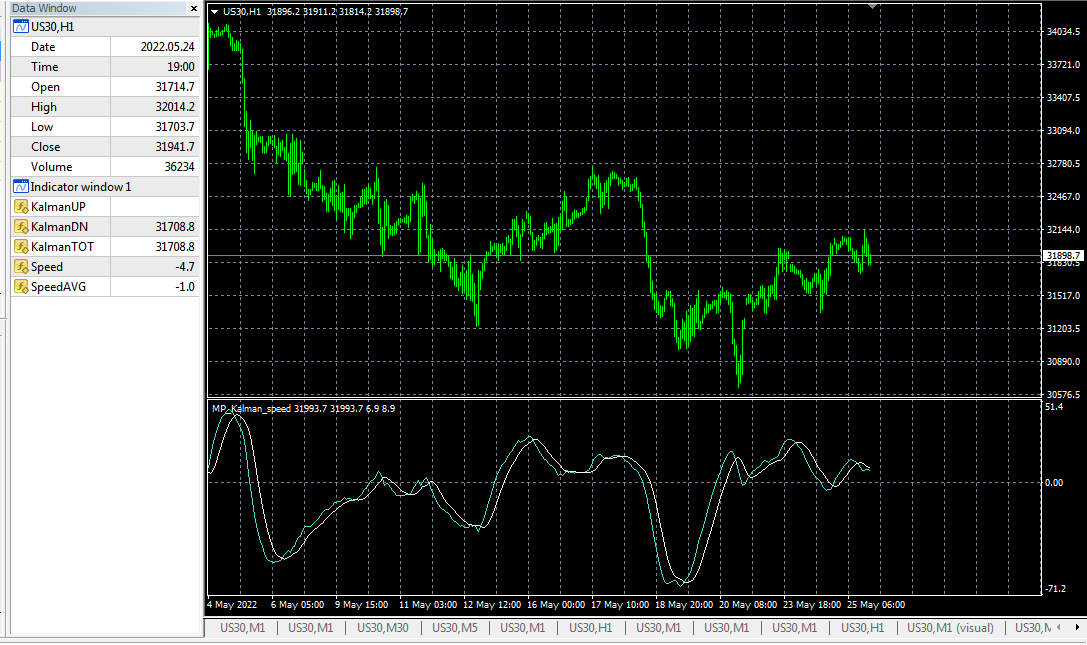
Just an experiment on try to using the "speed" (or correction factor?) of the Kalman filter as indicator..
Added a smooth "signal" line based on the moving average of the "speed" (that could be shifted some bars on parameters (positive or negative values)
Also, the buffers are named to help to understand what is being calculated

 Market High and Lows
This indicator shows market highs and lows for any timeframe with period separators. You can see daily/weekly/monthly highs/lows on lower timeframes like H1/M30/M40. This is good for trading breakouts.
ScalpX
ScalpX is an indicator that uses Kalman filters to identify buy and sell opportunities whenever is indicated by the graph.