Watch how to download trading robots for free
Find us on Telegram!
Join our fan page
Join our fan page
You liked the script? Try it in the MetaTrader 5 terminal
- Views:
- 10343
- Rating:
- Published:
-
Need a robot or indicator based on this code? Order it on Freelance Go to Freelance
The idea of the indicator
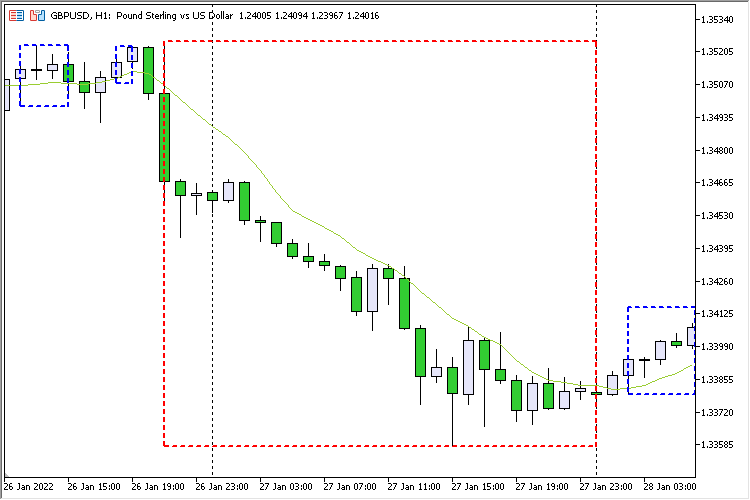
Find the moments when a fully formed candlestick (bar #1) crosses the 'Moving Average' indicator. Then we look for the previous intersection. Between the dates found, draw a rectangle.

Pic. 1. High Low Сluster
The borders of the rectangle (upper and lower) can be used as Stop Loss and Take Profit levels.
 MA or Price Histogram
Histogram between price and indicator or between two indicators
 DeMarker Pending
Strategy based on the 'DeMarker' indicator, working with pending orders
 DeMarker Pending 2
Development of the first version. Added parameters 'Maximum number of positions' and 'Minimum step of positions'
 Half Trend New Alert
Trend indicator. Added alerts (Sound, Alert, email, push)