Watch how to download trading robots for free
Find us on Telegram!
Join our fan page
Join our fan page
You liked the script? Try it in the MetaTrader 5 terminal
- Views:
- 8805
- Rating:
- Published:
-
Need a robot or indicator based on this code? Order it on Freelance Go to Freelance
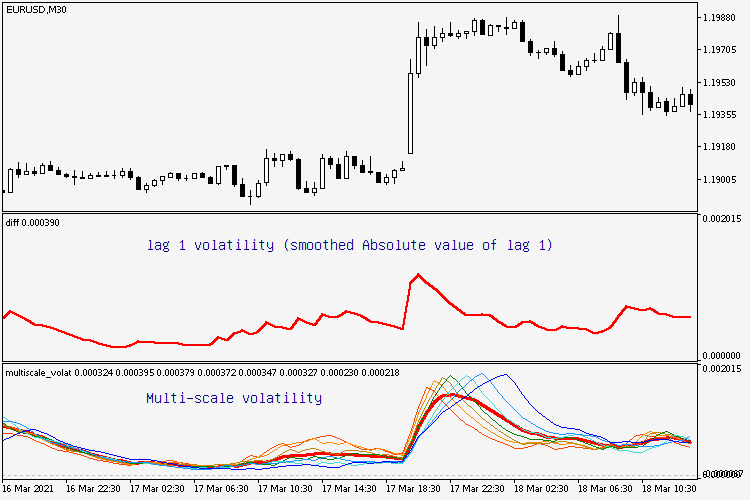
This indicator summarizes the volatility of multiple periods.the periods used are 3, 4, 5, 6, 8, 10, and 13.

Display:
- red bold line — summarized the volatility.
- red line — volatility of lag 3.
- orange line — volatility of lag 4.
- gold line — volatility of lag 5.
- green line — volatility of lag 6.
- turquoise line — volatility of lag 8.
- sky blue line — volatility of lag 10.
- blue line — volatility of lag 13.
Settings:
- smoothing period (default value = 14).
Features:
The difference is obvious when compared to the general lag 1 volatility.
 Ehlers Quotient Transform
Ehler´s Quotient Transform
 T3 floating levels (2)
Updated T3 floating levels
 The Decycler Oscillator
The Decycler: John Ehlers, "Cycle Analytics For Traders" by John Ehlers, pp. 43 - 44.
 IND - The Overall Percent Risk - MT5
Building good trading habits by seeing things in terms of percentage not in terms of money.