Watch how to download trading robots for free
Find us on Twitter!
Join our fan page
Join our fan page
You liked the script? Try it in the MetaTrader 5 terminal

CCI_Bar - indicator for MetaTrader 5
- Views:
- 5603
- Rating:
- Published:
-
 You are missing trading opportunities:
- Free trading apps
- Over 8,000 signals for copying
- Economic news for exploring financial markets
Registration Log inYou agree to website policy and terms of use
If you do not have an account, please register -
 Need a robot or indicator based on this code? Order it on Freelance
Go to Freelance
Need a robot or indicator based on this code? Order it on Freelance
Go to Freelance
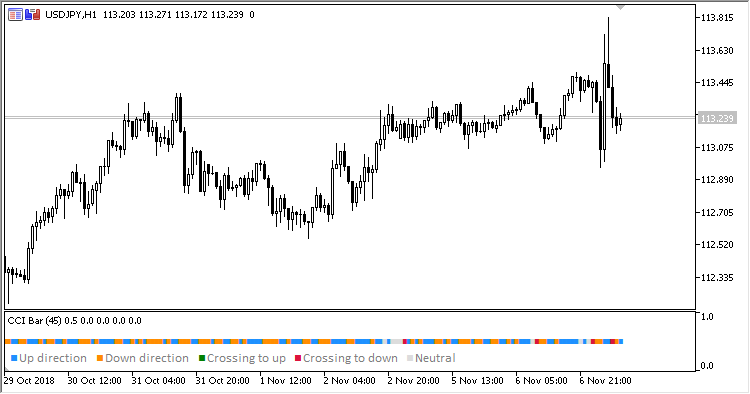
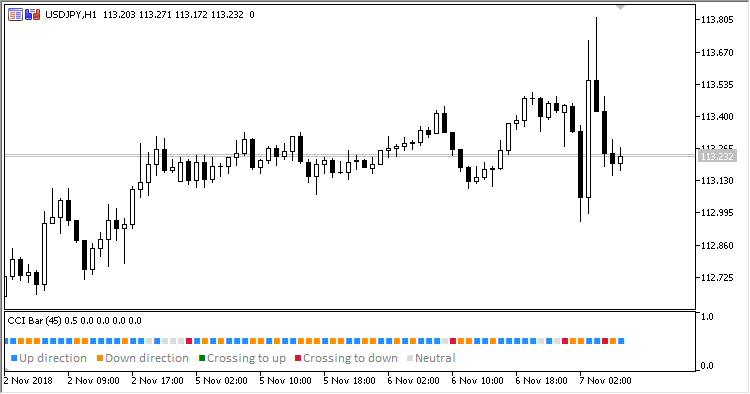
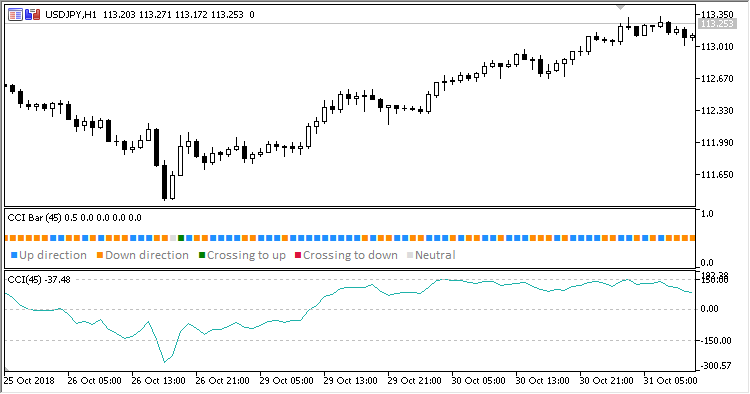
CCI Bar signal indicator. The indicator displays the colored diagram of CCI indicator status relative to its oversold/overbought levels (above/below/upward crossing/downward crossing).
There are five inputs:
- CCI period - CCI calculation period
- Overbought - overbought level
- Oversold - oversold level
- Buy entry level
- Sell entry level
- In case CCI value is within Overbought/Oversold levels
- If CCI values are increasing, blue signal pointers are set
- If CCI are falling, orange signal pointers are set
- If CCI value is beyond Overbought/Oversold levels, the gray signal pointers are set
- If Buy entry level is crossed upwards, the green signal pointer is placed
- If Sell entry level is crossed downwards, the red signal pointer is placed
Translated from Russian by MetaQuotes Ltd.
Original code: https://www.mql5.com/ru/code/23104
 E-Friday
Have a look at the daily bar #1. Position trailing.
Specified_Time_Range_Candles
Specified time range candles indicator
SpearmanRankCorrelation_Histogram_HTF
SpearmanRankCorrelation_Histogram indicator with the timeframe selection option available in input parameters
SpearmanRankCorrelation_Histogram
SpearmanRankCorrelation indicator implemented in the form of a color histogram