Join our fan page
- Views:
- 3954
- Rating:
- Published:
-
Need a robot or indicator based on this code? Order it on Freelance Go to Freelance
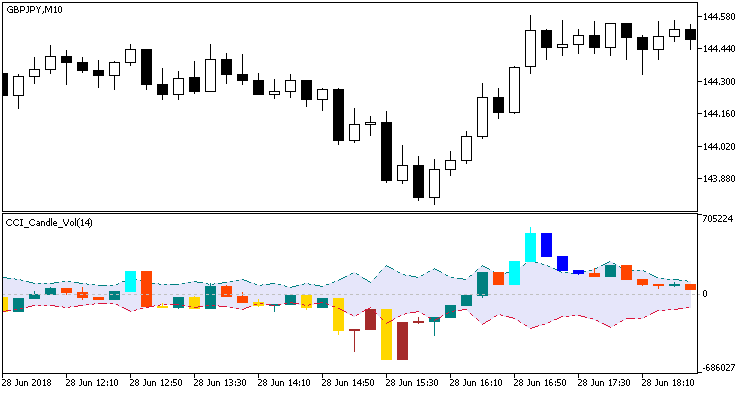
CCI_Histogram_Vol indicator in the candlestick form. Candlesticks appear as a result of relevant price timeseries processed by the indicator algorithm. In many situations, such approach may be more informative for the purpose of analysis.
In this version of the indicator, it is more reasonable to apply only one overbought and oversold level. The channel formed between these levels is colored lavender-blue and all candles closed inside this channel are colored classic green and red colors depending on the direction of the candle. Candles closed outside the channel are either aquamarine-blue or yellow-brown, depending on their direction to the channel.
//+-----------------------------------------+
//|  INDICATOR INPUT PARAMETERS             |
//+-----------------------------------------+
input uint                CCIPeriod=14;             // indicator period
input ENUM_APPLIED_VOLUME VolumeType=VOLUME_TICK;   // volume
input int                 HighLevel=+100;           // overbought level
input int                 LowLevel=-100;            // oversold level
input uint                Gap=10;                   // unconsidered gap in points
input int                 Shift=0;                  // Horizontal indicator shift in bars

Fig. 1. CCI_Candle_Vol
Translated from Russian by MetaQuotes Ltd.
Original code: https://www.mql5.com/ru/code/21916
 XRSI_Histogram_Vol_Direct
XRSI_Histogram_Vol indicator shows direction of the histogram bars movement using colored icons on these bars
 RenkoChart
Renko charts on custom symbols
 RSI_Candle_Vol
RSI_Histogram_Vol indicator in the candlestick form
 Iin_MA_Signal_Alert
Iin_MA_Signal semaphore signal indicator features alerts, emails and push notifications