Join our fan page

MA_Signal - indicator for MetaTrader 5
- Views:
- 7608
- Rating:
- Published:
- Updated:
-
 You are missing trading opportunities:
- Free trading apps
- Over 8,000 signals for copying
- Economic news for exploring financial markets
Registration Log inYou agree to website policy and terms of use
If you do not have an account, please register -
 Need a robot or indicator based on this code? Order it on Freelance
Go to Freelance
Need a robot or indicator based on this code? Order it on Freelance
Go to Freelance
A simple arrow signal indicator based on the intersection of four moving averages with different calculation data.
There are thirteen input parameters (three parameters for each of the four moving averages):
- First MA period - first MA calculation period
- First MA applied price - price used for the calculation of the first MA
- First MA method - first MA calculation method
- ... Similar parameters are used for the second, third and fourth MA
- Use swing signals - use only the direction change signals (Yes/No) (*)
Calculation:
Up Arrow:
MA1 > MA2 and MA3 > MA4
Down Arrow:
MA1 < MA2 and MA3 < MA4
where:
MA N - MA(MA N applied price, MA N period, MA N method)
* If you set Use swing signals = Yes, the arrows will only appear when the signal direction changes,
if Use swing signals = No, the indicator will show a color line of three dots (similar to that of Parabolic SAR) based on the largest-period MA prices, and only if the signal condition is met.
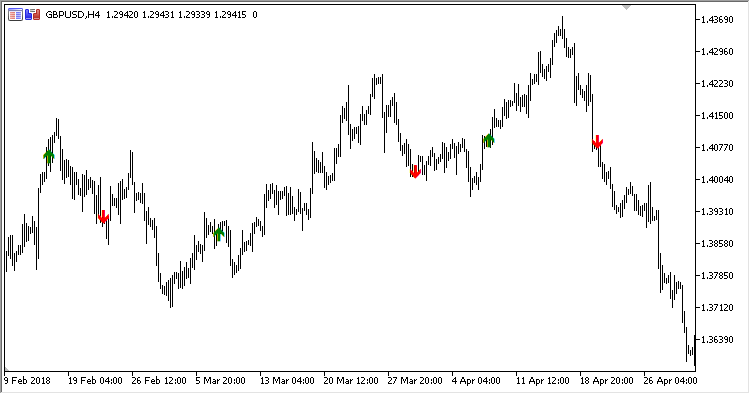
Fig. 1. Use swing signals = Yes
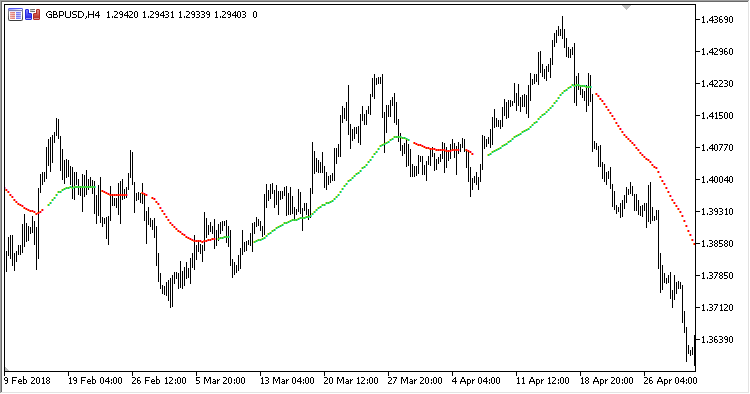
Fig. 2. Use swing signals = No
Translated from Russian by MetaQuotes Ltd.
Original code: https://www.mql5.com/ru/code/21839
Investor_Preference_Index
The Investor Preference Index indicator
CCI_Histogram_Vol
The Commodity Channel Index oscillator displayed as a color histogram, using volumes.
Modified_Moving_Average
The Modified Moving Average indicator
NRMA
The Nick Rypoсk Moving Average indicator