Join our fan page
- Views:
- 5920
- Rating:
- Published:
-
Need a robot or indicator based on this code? Order it on Freelance Go to Freelance
The indicator shows in the price chart the lowest top and the highest bottom over the last N periods. You can also use it to enable displaying the highest top and the lowest bottom.
It has three input parameters:
- Reverse period - period for calculating the highest bottom and the lowest top;
- Show Min/Max lines - switch to display levels Min/Max (Yes/No);
- Min/Max period - periof for calculating the Min/Max of the highest bottom and the lowest top.
Calculations:
ReverseMin[i] = Low[HL]
ReverseMax[i] = High[LH]
Min[i] = Low[LL]
Max[i] = High[HH]
where:
- HL - the highest bottom index over the Reverse period;
- LH - the lowest top index over the период Reverse period;
- HH - the highest top index over the Min/Max period;
- LL - the lowest bottom index over the Min/Max period.

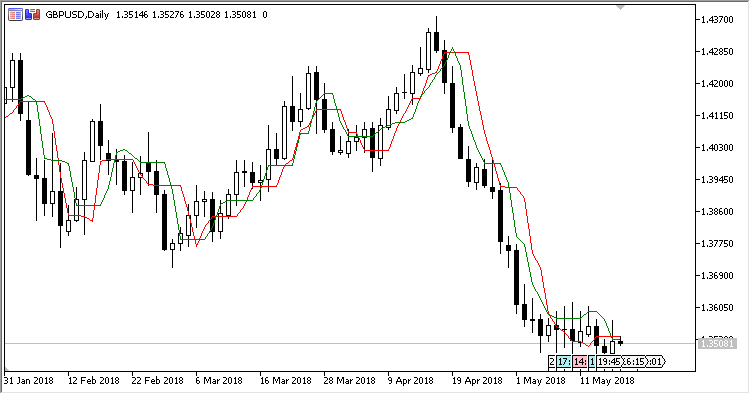
Fig.1 Displaying the highest Max and the lowest Min is disabled (by default)

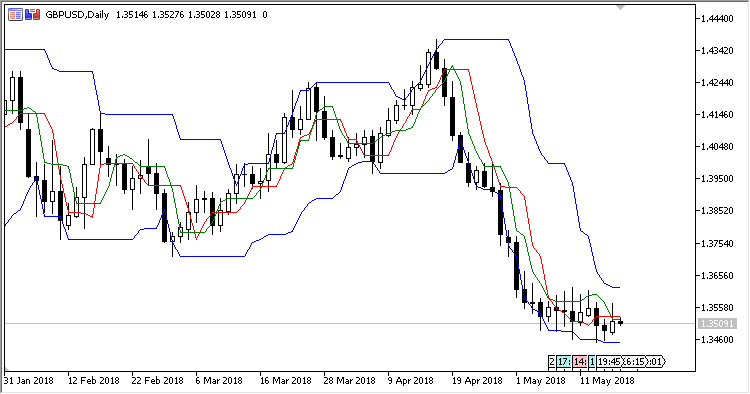
Fig.2 Displaying the highest Max and the lowest Min is enabled
Translated from Russian by MetaQuotes Ltd.
Original code: https://www.mql5.com/ru/code/20805
 Onisuk_Filter
Direction Filter Indicator.
 MIT
MIT
Oscillator MIT (Momentum In Time) is a normal momentum with anchoring the calculations to the calculation start time.
 ASCtrend_NRTR
Indicator ASCtrend with the NRTR line of possible stop order locations.
 RTR
RTR
Oscillator RTR (Range To Range) shows the ratio of two ATRs, a fast one and a slow one. Indicator RTR (Range To Range)