Join our fan page

Phase Change Index - indicator for MetaTrader 5

- Views:
- 7754
- Rating:
- Published:
-
 You are missing trading opportunities:
- Free trading apps
- Over 8,000 signals for copying
- Economic news for exploring financial markets
Registration Log inYou agree to website policy and terms of use
If you do not have an account, please register -
 Need a robot or indicator based on this code? Order it on Freelance
Go to Freelance
Need a robot or indicator based on this code? Order it on Freelance
Go to Freelance
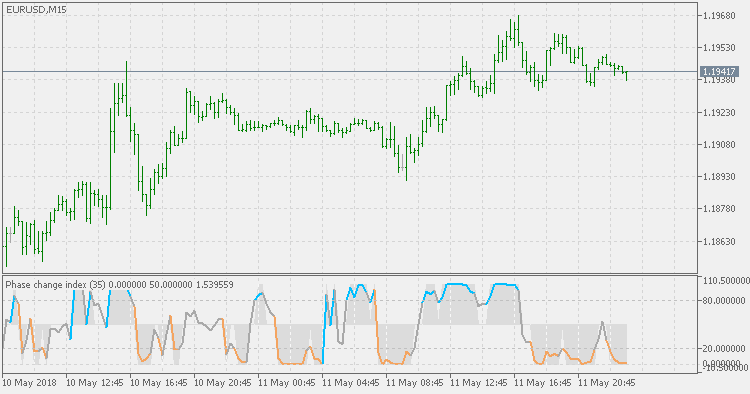
Based on the M.H. Pee's TASC article "Phase Change Index".
Prices at any time can be up, down, or unchanged. A period where market prices remain relatively unchanged is referred to as a consolidation. A period that witnesses relatively higher prices is referred to as an uptrend, while a period of relatively lower prices is called a downtrend.
The Phase Change Index (PCI) is an indicator designed specifically to detect changes in market phases.
This indicator is made as he describes it with one deviation: if we follow his formula to the letter then the "trend" is inverted to the actual market trend. Because of that an option to display inverted (and more logical) values is added.
T3 bands
Variation of the well known Bollinger Bands indicator.
T3 Deviation
T3 Deviation uses intermediate steps of T3 calculation to get the deviation based on T3. As expected the deviation calculated this way is much smoother than the Standard Deviation (as a result of using T3 which on its own is smoother than the simple moving average), and is "faster" in response to market changes.
Trend Continuation Factor - Jurik smoothed
Trend Continuation Factor (TCF) indicator with Jurik smoothing identifies the trend and its direction.
Trend Continuation Factor
Trend Continuation Factor (TCF) indicator identifies the trend and its direction.