Join our fan page

EMA Levels MTF - indicator for MetaTrader 5

- Views:
- 14277
- Rating:
- Published:
-
 You are missing trading opportunities:
- Free trading apps
- Over 8,000 signals for copying
- Economic news for exploring financial markets
Registration Log inYou agree to website policy and terms of use
If you do not have an account, please register -
 Need a robot or indicator based on this code? Order it on Freelance
Go to Freelance
Need a robot or indicator based on this code? Order it on Freelance
Go to Freelance
There seems to be at a moment serious lack of multi timeframe versions of MetaTrader 5 indicators. Since there is no real reason for that, here is one more multi timeframe version.
This is a multi timeframe version of EMA Levels.
Timeframes supported are all the possible timeframes supported by MetaTrader 5 and it has 3 "special" timeframes:
- Next higher timeframe: first higher timeframe compared to active chart.
- Second higher timeframe: second higher timeframe compared to active chart.
- Third higher timeframe: third higher timeframe compared to active chart.
If some of these 3 timeframes are used, then the timeframe is set automatically as you change the timeframe of the chart.
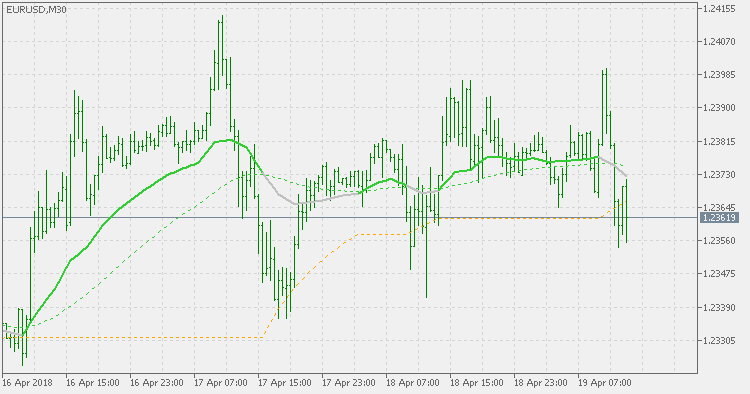
Option that sometimes causes some confusion is the interpolation.
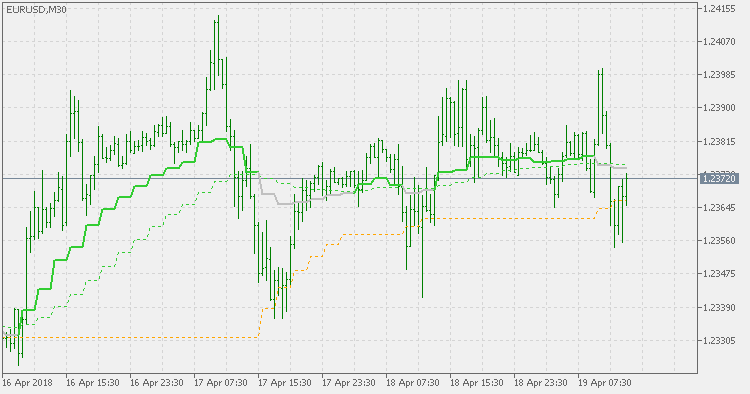
Interpolation is taking effect only in multi timeframe mode. It, instead of having the step like data display on chart, uses linear interpolation to make a smoother display. When it is turned off, here is how the upper example looks like:
Some are arguing that it produces false values. That is actually not true. If we compare the "classic" way of displaying multi timeframe data (the "step like" way) and interpolated multi timeframe data, the number of guaranteed exact points is exactly the same: 1 per timeframe. The rest is, in a step like way, repeated at bars where that value did not exist, and interpolated way is adjusting those values in a more logical ("smoother") way, and, in most cases it is even much closer to what was going on in runtime than the classical multi timeframe way.
Schaff trend RSX mtf
Schaff Trend RSX multi timeframe version.
Schaff Trend RSI MTF
Schaff Trend RSI multi timeframe version.
Stochastic volatility
This is not a directional indicator. This means that even it is stochastic it does not show the direction of the market, but shows the direction-amount-size of volatility. The assumption that seems sound enough and after which this indicator is made is that in the times of extremely low volatility it is a good time to enter the market, since the change in volatility is imminent. Those times are marked by dark gray dots on this indicator. For direction of entry, you should use some other trend showing indicator(s).
Heiken Ashi Oscillator
Instead of using "pure price" this indicator uses Heiken Ashi values to determine the trend as well as the "strength" of the trend.