Join our fan page

RSI of Hull - indicator for MetaTrader 5

- Views:
- 7534
- Rating:
- Published:
-
 You are missing trading opportunities:
- Free trading apps
- Over 8,000 signals for copying
- Economic news for exploring financial markets
Registration Log inYou agree to website policy and terms of use
If you do not have an account, please register -
 Need a robot or indicator based on this code? Order it on Freelance
Go to Freelance
Need a robot or indicator based on this code? Order it on Freelance
Go to Freelance
The Relative Strength Index (RSI) is a momentum indicator developed by noted technical analyst Welles Wilder, that compares the magnitude of recent gains and losses over a specified time period to measure speed and change of price movements of a security. It is primarily used to attempt to identify overbought or oversold conditions in the trading of an asset.
Being a momentum indicator, RSI tends to be "over-reactive" (using slope of the RSI for a trend signals is usually a bad idea). One of the ways to change that is to filter the prices prior to using it in calculation - that way the values of the RSI are much smoother and the false signals are lessened significantly.
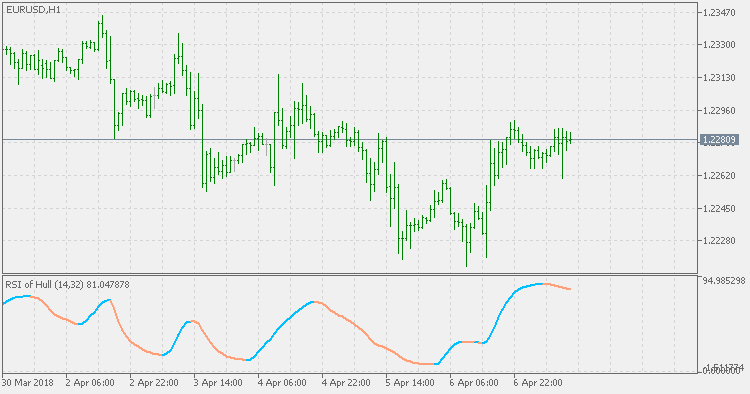
PS: using Hull period less than or equal to 1 produces the RSI values same as the RSI without Hull Average.
Triple Hull
The indicator is using 3 instances of Hull Moving Average.
RSI bands
The RSI bands indicator helps in multiple ways, but mainly in visualizing on the main chart what price change would trigger the expected overbought or oversold signals.
Zero lag MA
According to creators, the ZeroLAG MA indicator is a Moving Average with zero delay. If we agree or not, does not matter since, compared to some "regular" Moving Averages the lag it has is significantly lower, so it can be used in any system where less lag is of great importance.
Zero lag DEMA
This indicator uses DEMA calculation mode in order to make the lag lesser compared to the original Zero lag MA, and that makes this version faster.