Join our fan page

Volume Average percent - indicator for MetaTrader 5

- Views:
- 17595
- Rating:
- Published:
-
 You are missing trading opportunities:
- Free trading apps
- Over 8,000 signals for copying
- Economic news for exploring financial markets
Registration Log inYou agree to website policy and terms of use
If you do not have an account, please register -
 Need a robot or indicator based on this code? Order it on Freelance
Go to Freelance
Need a robot or indicator based on this code? Order it on Freelance
Go to Freelance
In capital markets, volume, or trading volume, is the amount (total number) of a security (or a given set of securities, or an entire market) that was traded during a given period of time. In the context of a single stock trading on a stock exchange, the volume is commonly reported as the number of shares that changed hands during a given day. The transactions are measured on stocks, bonds, options contracts, futures contracts and commodities. The average volume of a security over a longer period of time is the total amount traded in that period, divided by the length of the period. Therefore, the unit of measurement for average volume is shares per unit of time, typically per trading day.
Trading volume is usually higher when the price of a security is changing. News about a company's financial status, products, or plans, whether positive or negative, will usually result in a temporary increase in the trade volume of its stock. Shifts in trade volume can make observed price movements more significant. Higher volume for a stock is an indicator of higher liquidity in the market. For institutional investors who wish to sell a large number of shares of a certain stock, lower liquidity will force them to sell the stock slowly over a longer period of time, to avoid losses due to slippage.
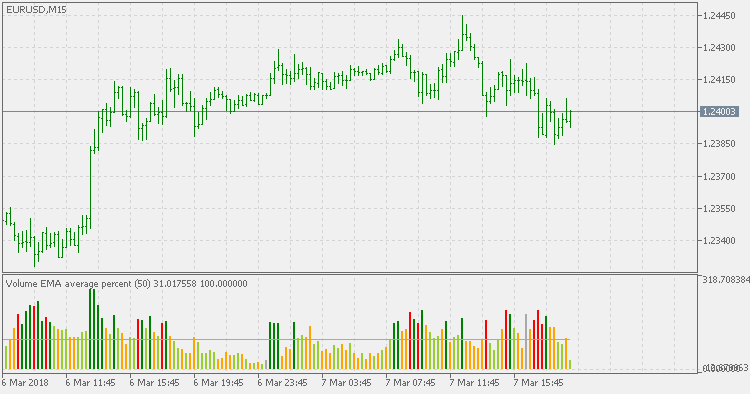
This version is a sort of normalized version - since it shows Volume as a percent compared to the Average Volume over a chosen period.
With MetaTrader 5 now you can chose if the volume used is going to be tick volumes or real volumes. Percentage breakouts compared to average volume are marked with different colors.
Volume Average
Long known volume analysis method.
McGinley Dynamic Indicator
The McGinley Dynamic indicator was developed by John McGinley and outlined in the Market Technicians Association's "Journal Of Technical Analysis" in 1991. The purpose of this indicator is to address flaws found in conventional moving averages, such as price separation and whipsaws. The result is a remarkable indicator that follows the average price of an instrument while adapting to current market speeds.
Inverse Fisher CCI
CCI is a very useful indicator. But it lacks one thing: known bounds. Adding Inverse Fisher Transform to CCI makes it oscillate in known bounds, and that way it can help in assessing what is exactly going on with the markets.
Candle Closing Time Remaining (CCTR) MT5
MetaTrader 5 version of Candle Closing Time Remaining (CCTR) is an indicator which displays the remaining time for an open candle to be closed.