 MetaTrader 5
 Experts
 Indicators
 Scripts
 Libraries
 Storage
Watch how to download trading robots for free
Find us on Twitter!
Join our fan page
Join our fan page
You liked the script? Try it in the MetaTrader 5 terminal

i-SpectrAnalysis_Chaikin - indicator for MetaTrader 5

- Views:
- 4901
- Rating:
- Published:
- Updated:
-
 You are missing trading opportunities:
- Free trading apps
- Over 8,000 signals for copying
- Economic news for exploring financial markets
Registration Log inYou agree to website policy and terms of use
If you do not have an account, please register -
 Need a robot or indicator based on this code? Order it on Freelance
Go to Freelance
Real author:
klot
This indicator is an example of smoothing the Chaikin Oscillator indicator timeseries by filtering high-order harmonics.
You can use this approach for smoothing the output of any indicator. The major advantage of this method is that it has practically zero latency.
Indicator input parameters:
input uint                fast_ma_period=3;       // Fast period
input uint                slow_ma_period=10;      // Slow period
input ENUM_MA_METHOD       ma_method=MODE_LWMA;   // Smoothing types
input ENUM_APPLIED_VOLUME VolumeType=VOLUME_TICK; // Volume
input uint N = 7;                                 // Series length
input uint SS = 20;                               // Smoothing coefficient
input int Shift=0;                                // Horizontal indicator shift in bars
where:
- N — sets the series length (power of two);
- SS — smoothing coefficient in the resulting spectrum zeroes out frequencies exceeding the set value. SS cannot be greater than 2^N. If SS = 2^N, the Chaikin Oscillator series is repeated.
This indicator requires the following library: https://www.mql5.com/ru/code/7000.
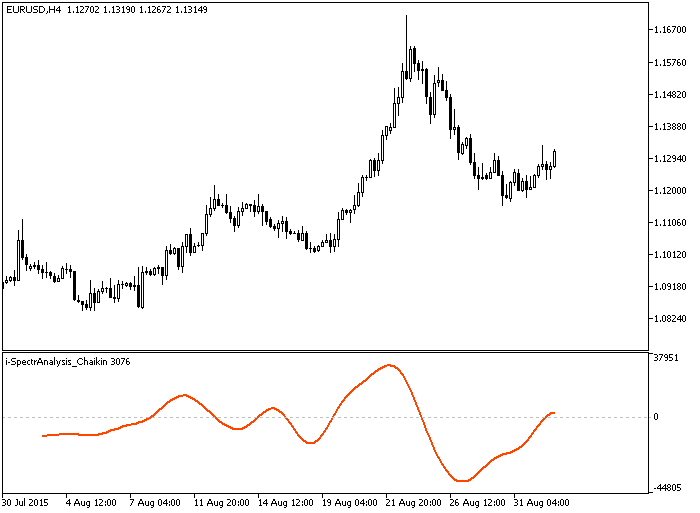
Fig.1. The i-SpectrAnalysis_Chaikin indicator
Translated from Russian by MetaQuotes Ltd.
Original code: https://www.mql5.com/ru/code/13756
i-SpectrAnalysis_DeMarker
This indicator is an example of smoothing the DeMarker indicator timeseries by filtering high-order harmonics.
i-SpectrAnalysis_Force
This indicator is an example of smoothing the Force Index indicator timeseries by filtering high-order harmonics.
i-SpectrAnalysis_WPR
This indicator is an example of smoothing the Larry Williams' Percent Range indicator timeseries by filtering high-order harmonics.
Force_3HTF
Three Force Index indicators from three different timeframes displayed on the same chart.