

A small historical drawdown can make an Expert Advisor look easier to live with. It does not explain why the decline was small, what risk remained open or how the system will behave next. Low exposure, a short favourable sample and incomplete equity observations can produce very different interpretations of the same percentage.
This guide is about comparing EA candidates. There is no universal drawdown percentage that makes a trading system safe. Start with the measurement basis, the account conditions and the evidence you can actually inspect.
1. Measure the fall from the right peak
Drawdown is a decline from a prior account peak. In a hypothetical example, equity rises from £10,000 to £12,000 and then falls to £10,800. The decline is £1,200, or 10% of the £12,000 peak. Dividing by the original deposit gives 12%, which answers a different question.
Balance reflects closed outcomes; equity also includes open profit and loss. An EA can close small winners while retaining substantial floating losses. A smooth balance chart alone can therefore conceal exposure. Sampling matters too: an hourly equity series can miss a sharp intrahour low. Different observation methods can produce different maxima without proving manipulation.

Hypothetical arithmetic, not an actual account result.
2. Compare like with like
Match the period, account currency and risk settings wherever possible. Identify deposits, withdrawals and configuration changes. A system running at one-quarter of another account's exposure has not necessarily demonstrated a better strategy because its decline is smaller.
Separate depth, duration and recovery time. A shallow decline lasting months can be difficult to operate through. If recovery has not occurred by the reporting cutoff, record that. Check positions still open at the end rather than choosing a date immediately before a loss closes.
Money and percentage also answer different questions. A second hypothetical account rises from £50,000 to £55,000 and falls to £51,150. Its decline is 7% but £3,850 in money. Neither this account nor the first is automatically safer: available capital, exposure and observation periods may differ.
3. Understand recovery arithmetic
A loss reduces the capital from which recovery must be earned. A 10% decline requires an 11.11% gain to regain the previous peak; a 20% decline requires 25%; a 50% decline requires 100%. These are arithmetic relationships, not forecasts.
For a hypothetical £10,000 account losing £2,000, the remaining £8,000 must earn £2,000 to recover. That is 25% of the remaining capital. Increasing position size to accelerate recovery also increases the risk of further loss. A previous recovery does not establish that another one will happen.
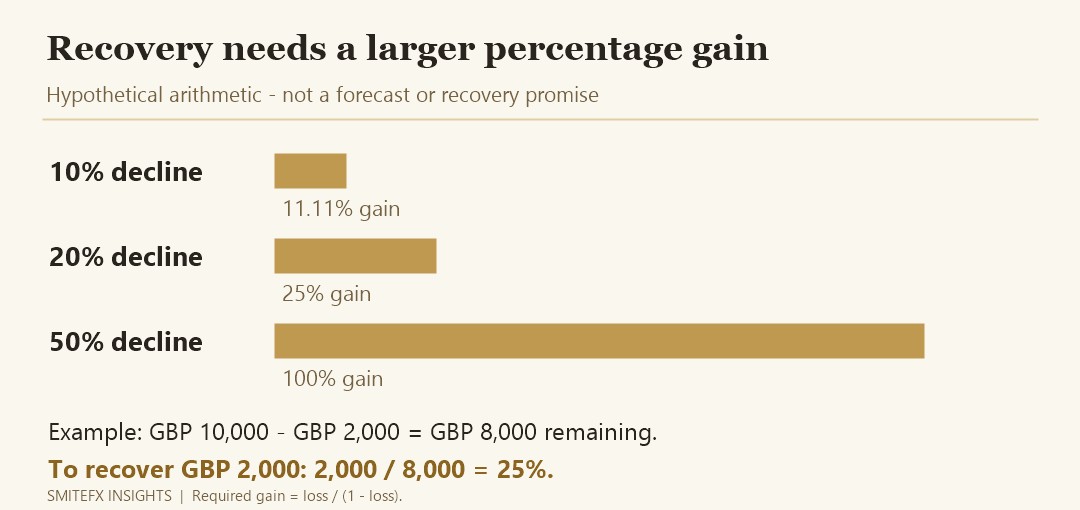
Required recovery is arithmetic, not a forecast or promise.
4. Read recovery factor with its definition
One commonly used recovery factor divides net profit by maximum monetary drawdown. State the definition, period and drawdown basis before comparing values. The MetaTrader 5 testing-report reference distinguishes balance and equity drawdown and explains its recovery-factor calculation.
A hypothetical £4,000 profit divided by a £1,000 maximum monetary decline gives four. It does not mean the strategy survives four future crises or completed four independent recoveries. A short record, changing exposure, financing costs and missed intraday lows can all weaken the interpretation. Avoid universal thresholds or a one-number league table.
5. Investigate the stability mechanism
Ask how positions are sized, whether total exposure has a finite cap and what happens after losses. Explicit limits give you something concrete to test, but cannot guarantee an exact exit price or maximum future loss.
Distinguish fixed-size averaging from increasing-size recovery. Both can accumulate directional exposure, although their volume paths differ. “No martingale” alone does not describe the largest combined position or explain whether losing trades remain open.
Review the whole account. Several individually modest EAs can respond to the same currency shock. During a recovery, note whether exposure falls, stays unchanged or rises. If parameters change, retain the chronology: the later recovery is evidence of the combined process and intervention, not independent validation of the original settings.
6. Include execution and reporting limits
Long holding periods can change financing costs; short holding periods can increase sensitivity to spread and commission. Compare broker specifications, actual fills and rejected requests. Minimum trade volume and account size can prevent a smaller account reproducing the fractional risk of a larger one.
Check account type, history visibility, last update and the connection between the record and advertised configuration. Myfxbook's verification guide explains its verification checks; neither is a risk certification. A badge does not prove exclusive EA control, complete public history or suitability for your account. Missing information is a limitation to investigate, not automatic proof of wrongdoing.
Historical testing and current demo operation add different evidence. Test adverse costs and persistent trends where relevant. The purpose is to discover sensitivity, not to manufacture a maximum-possible-drawdown claim.
7. Keep a candidate review record
For each EA, record the observed decline, equity or balance basis, dates, duration, sampling, exposure changes and unresolved questions. Add affordability and operating complexity separately. Preserve the evidence and review date; update the record when a new maximum appears rather than silently replacing the earlier conclusion.
Choose reject, investigate or continue testing. You can reject a candidate because exposure cannot be understood without alleging fraud or predicting collapse. Define pause rules and a tolerable allocation before live use. A history showing 6% drawdown does not justify risking money you cannot afford to lose beyond 6%.
Applying the checklist to SmiteFX
If you are reviewing Fortune MT5, apply the same questions to its available account history, operating requirements and exposure information. Inspect Fortune, Fortress and Frontier separately through the SmiteFX Systems page; do not assign them a shared drawdown profile. No product reference here establishes a future loss ceiling.
For copy trading, assess follower equity, costs and allocation rather than expecting the source account's exact decline. For the broader due-diligence process, use the pre-live EA evaluation guide.
Adapted from the SmiteFX Insights article. Its linked reporting definitions were checked on 31 October 2026. Both illustrations and all numerical examples are hypothetical arithmetic, not actual account results. Historical maximum drawdown is not a maximum possible future loss. Trading involves risk; this is education, not personalised investment advice.



