I measured 421 tests of gold's round hundreds. They bounced 52.7% of the time — and the map is still worth having

Round numbers on gold look important. Everybody watches 3500, 3600, 4000. After a few sessions it is easy to remember the touches that bounced and forget the ones that went straight through. I wanted a count, not a memory.
This note measures how often those figures actually held, and it introduces a free MetaTrader 5 indicator that puts the same map on the chart: round numbers, the prior day and week extremes, and a simple average-daily-range budget.
The indicator is here: Gold Level Map (XAUUSD): Round Numbers, Prior Day/Week Extremes and ADR. It does not trade and it is not a signal.
How I counted
Broker XAUUSD ticks are not a public series, so the study uses COMEX Gold futures (GC=F) daily bars from Yahoo Finance, from 1 January 2023 to 20 November 2026 — 979 daily bars. That is an illustration of the idea, not a copy of what you will see on your broker’s XAUUSD chart, and not a Strategy Tester report.
The rule is conservative and uses only completed daily bars:
- A test starts when a daily bar first trades through the level after the previous close was clearly on one side.
- Bounce: a later close returns to the approach side by a buffer of 0.20 × the median daily range (about $8.2 in this sample).
- Break: a later close goes through the level by the same buffer.
- If eight daily bars pass without either side winning, the episode is left open and is excluded from the bounce rate.
- Levels with fewer than five tests are omitted from the totals, so a handful of noisy figures cannot dominate the headline.
The published indicator works the same way in spirit, but it scores reactions on closed H1 bars of the chart symbol, which is finer than these daily charts.
What the numbers actually say
On that public daily sample:
- 29 hundred-levels with at least five tests: 421 tests, 222 bounces, 199 breaks. The decided bounce rate is 52.7%.
- 29 fifty-levels with at least five tests: 444 tests, bounce rate 50.0%.
In other words, a round hundred on gold is a place people look at, not a wall. A rate near 50% is a normal result. Individual figures differ, and figures with only a handful of tests are noisy. That is why the rate should always be shown next to the raw counts.
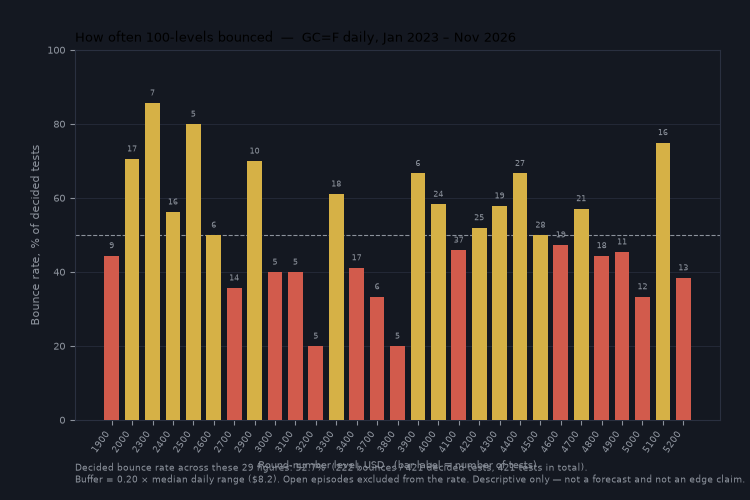
Figure 1. Bounce rate at each hundred-level with at least five tests. The dashed line is 50%. The number above a bar is the number of tests. Source: Yahoo Finance, COMEX Gold (GC=F). Descriptive only — not a forecast and not an edge claim.
Why the map is still useful
If the typical hundred does not hold more often than a coin toss, why draw it at all?
Because this is where attention already sits. Stops, targets and “just beyond the figure” entries cluster around 00 and 50 whether or not the level has a statistical edge. The useful question on a given day is more modest: how far is price from the nearest figure, how much of the average daily range is already used, and where are yesterday’s and last week’s extremes?
That is what the map is for. It does not predict the next bounce. It keeps those prices in view, with the distance in money and in ATR, and with an honest table of recent tests.
The October–November 2026 decline is a clear example. Gold walked down through a whole staircase of hundreds and fifties. Some figures paused the move for a day; most did not hold. The map still tells you, bar by bar, which figure is next and how stretched the day already is.
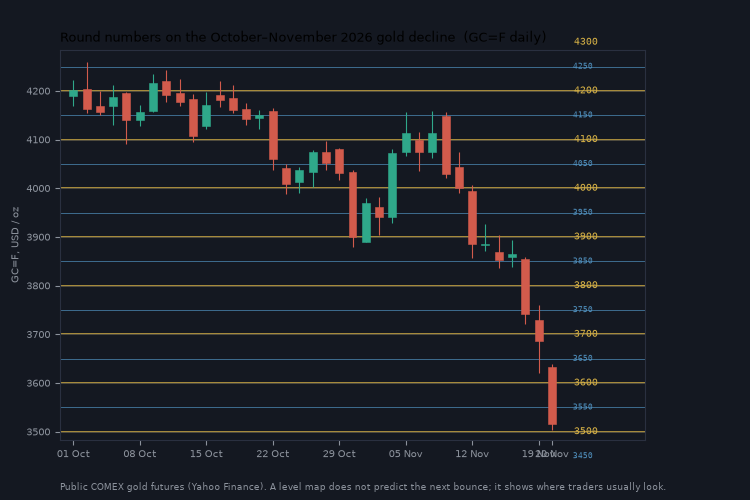
Figure 2. Daily COMEX gold (GC=F) from early October to 20 November 2026, with 00 and 50 figures marked. A level map does not predict the next bounce; it shows where traders usually look. Source: Yahoo Finance.
What the indicator puts on the chart
Gold Level Map draws, in a dark-theme layout:
- major and mid psychological levels (typically 100 and 50 on XAUUSD; the step is automatic on other symbols);
- previous day high and low, the current day open, previous week high and low;
- an ADR band from the day open, and how much of that average range has already been used today;
- labels with the tag, the price and the distance from the last bid;
- a corner panel with the nearest figures and a short H1 reaction table.
Previous-period extremes use completed bars. Reactions and alerts use closed bars. Today’s high, low and distances update as the current day develops — that is not a historical signal being rewritten.
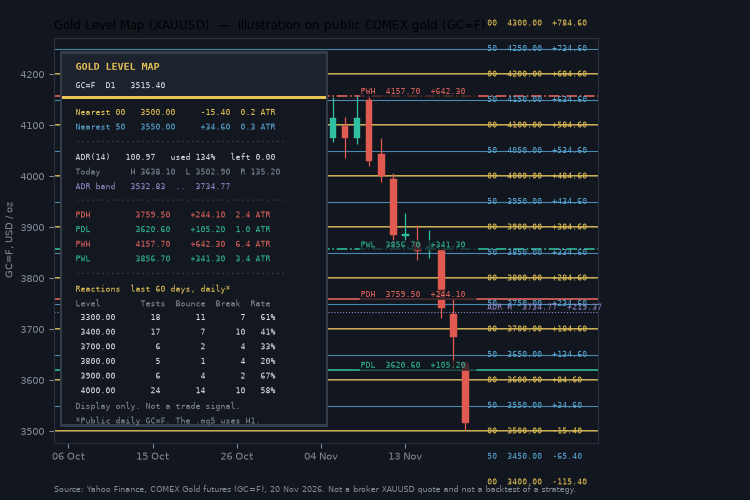
Figure 3. Illustration of the panel and the labelled levels on public GC=F daily bars, 20 November 2026. The live indicator reads your broker’s symbol and scores reactions on H1. Source: Yahoo Finance. Not a backtest of a strategy.
How I use it
- I attach it to XAUUSD, usually on H1, M15 or H4.
- Before I plan anything, I read the nearest 00 and 50, the leftover ADR, and PDH / PDL. If the day has already used more than 100% of ADR, a late entry has less “average” room left. That is a budget, not a barrier.
- I treat PWH and PWL the same way I would draw last week’s high and low by hand.
- I leave the alerts off until I have watched a few sessions, then I enable only the levels I care about.
- I do not treat a high bounce rate in the table as a buy or a sell.
The source is open, it has no DLL and no internet request, and it works on any symbol with enough D1 and H1 history. Defaults are chosen for gold.
Where to get it
- CodeBase (free source): Gold Level Map (XAUUSD)
- Other free tools by the same author: https://www.mql5.com/en/users/krechet233
If you want to see how I apply risk and context on gold inside an Expert Advisor, the current version of Golden Sniper XAU is on the Market. This note is about the map, not about that robot, and nothing here is a trading signal.



