
A range can look wide enough to trade until you price the entry and exit on the correct sides of the quote. The difference matters most when you are waiting for a return toward the middle of a narrow range. This walkthrough takes a hypothetical chart setup, puts executable prices on it and shows what to record before deciding whether the opportunity leaves enough room.
Start with a repeatable view of the range
A range is an area where price has been moving back and forth between two boundaries. Mark the area using data visible before you would have entered. Decide whether a wick, a close or repeated reactions define each boundary. If you redraw the boundary every time price approaches it, comparing setups becomes difficult because yesterday’s decision used a different definition from today’s.
SimpleRange is one of the discretionary methods in the Forex Top Team toolkit. The Navigator shows the setup and suggested entry, stop-loss and take-profit levels. Treat the levels as inputs to your decision. For a range trade, ask where the idea fails, which quote side your exit uses and whether those prices still give the trade enough room after your broker’s costs.
Put both sides of the quote on the chart
The bid is the sell side of the quote for the trader and the ask is the buy side. The spread is the ask minus the bid. MetaTrader 5 charts for OTC symbols use bid prices, and the platform offers a separate ask line. A long position opens at the ask and closes at the bid in the simplified market-order example below. A short reverses those sides, so watch the ask when you assess a short exit. MetaTrader 5 chart settings and the ask line.
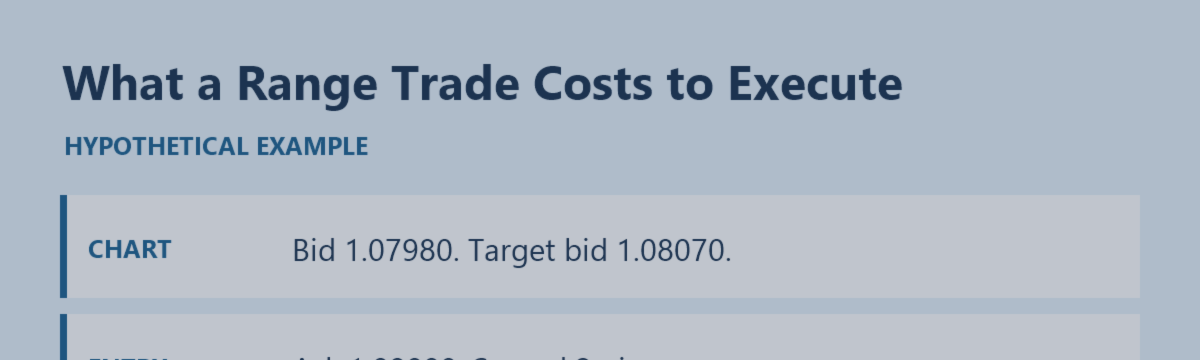
Suppose a hypothetical EUR/USD bid chart shows 1.07980 as you consider a long. The ask is 1.08000 and you assume a fill there. If the target exit is at a bid of 1.08070 and the stop exit is filled at a bid of 1.07950, the target is 7 pips from entry and the stop is 5 pips away. One EUR/USD pip equals 0.0001 USD per EUR. At EUR 10,000 those distances correspond to USD 7 and USD 5 before commissions and any additional slippage.
View the hypothetical range execution diagram.
Measuring from the bid chart alone would show 9 pips up and 3 pips down. The spread was 2 pips at the assumed entry, so it reduces the upside to 7 and increases the downside to 5 under these exit assumptions. Since the 7 and 5 already use the ask entry and bid exits, subtracting another 2 pips as a separate cost would double-count the entry spread. If your broker charges commissions, apply them separately using the correct account currency.
Run one spread stress test
Keep the same hypothetical bid and exit prices, but widen the entry spread to 4 pips. A long would now enter at 1.08020 if filled at that ask. The bid target is 5 pips away and the bid stop is 7 pips away. The gross ratio of planned reward to planned risk falls from 7 ÷ 5, or 1.4, to 5 ÷ 7, or about 0.71. Neither ratio tells you how often the target is reached. The test shows how much the same chart layout depends on the available entry quote.
Live trades add differences that a fixed example cannot capture. A quote can change between observation and execution. A stop can fill away from its trigger price, and your feed reflects the liquidity available through your provider. Check order type, trigger conditions and price at the time of the actual decision. Record a missed or skipped trade when the quoted entry no longer matches the plan. MetaTrader 5 Market Watch documentation. BIS research on FX trade execution.
Review the range under comparable conditions
Collect consecutive examples for the same pair and session. For each, save the bid and ask, chart time and timezone, intended entry and exit sides, and any minimum price distance your broker applies. If a wider spread rules out the opportunity, log the rejection. A review of filled trades alone hides how many apparently attractive ranges were expensive to enter.
- Mark the boundaries before the test and state when a range is invalidated.
- Record the executable entry side and the quote side required for each exit.
- Compare distances after the spread and include commissions separately.
- Stress-test the setup with a less favorable quote and record what would make you pass.
A common misunderstanding is that a tidy range guarantees an orderly exit. If the boundary breaks, the quote can jump through the stop level. Review whether the range had enough room under the prices available at the time rather than counting ideal fills on a historical chart. For the on-chart method, see SimpleRange in the Forex Top Team Trading Toolkit. The provider describes qualifying partner accounts and discloses potential compensation tied to referred clients’ trading activity.
For a separate example of a tool designed to examine mean reversion, see Reversion Kernel M5 in Forex Top Team’s MT5 indicator collection.




