
Sniper Spike Detector is a scalping indicator for Boom and Crash on Deriv, and PainX and GainX on Weltrade. This guide shows you how to install it, how to read the signals, and how to use the dashboard and the settings menu.
Contents
- Supported pairs and timeframe
- Installation
- Understanding the signals
- How to trade with it
- Market mode
- The dashboard
- The settings menu
- Trade levels: entry, take profit and stop loss
- Auto-optimize
- Display and alerts
- Sniper Trend
- Using it in the Strategy Tester
- Indicator inputs
- Tips and common questions
Trading synthetic indices carries risk. Test on a demo account first. Nothing in this guide is financial advice.
1. Supported pairs and timeframe
- Deriv: all Boom and Crash indices
- Weltrade: PainX and GainX pairs
- Timeframe: M1 (1 minute chart)
The indicator is built and tested for the above. It has been more accurate on the lower-volatility indices, such as Boom 50 and Crash 50, than on Boom 1000 and Crash 1000. The dashboard shows the win rate on your own chart, so check the pair you plan to trade before relying on it.
2. Installation
- Buy and download the indicator from the MQL5 Market. It installs into your terminal automatically.
- Open a chart of a supported pair and set it to M1.
- In the Navigator window, open Market and drag Sniper Spike Detector onto the chart.
- Leave the settings as they are for now and press OK.
The indicator applies its own chart colours (charcoal background, olive and sage candles). If you want to keep your own colours, turn off "Apply Stealth Military chart colors" in the Inputs tab.
The Sniper Trend indicator is built in. It is added automatically in its own window under the chart, so you do not need to download or install anything else.
3. Understanding the signals
The indicator draws an arrow on a candle once that candle has closed. It does not redraw, and an arrow does not disappear later.
- Buy signals are lime arrows pointing up, drawn below the candle.
- Sell signals are orange arrows pointing down, drawn above the candle.
Which signals you see depends on the pair. On Boom and GainX it shows buy arrows only. On Crash and PainX it shows sell arrows only. See "Market mode" below.
4. How to trade with it
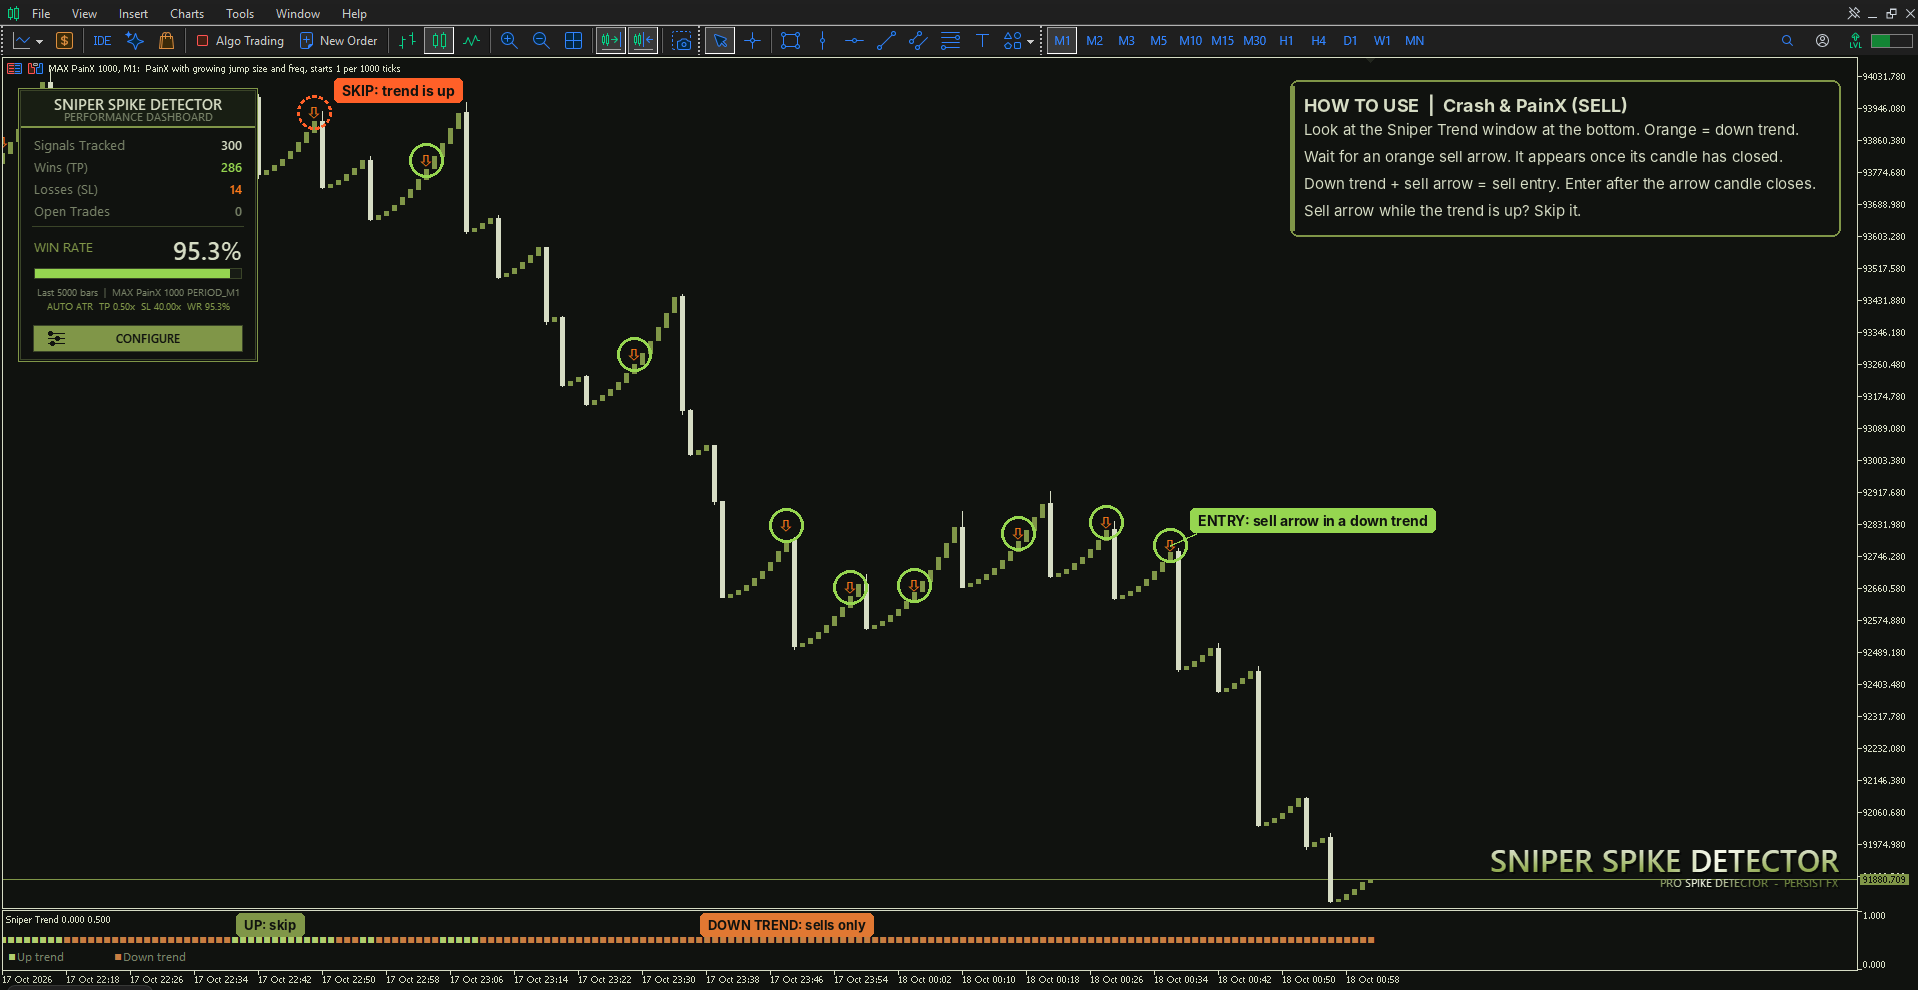
An arrow on its own is not a trade. Check it against the trend in the Sniper Trend window under the chart.
Boom and GainX (buys)
- Look at the Sniper Trend window. Green dots mean an up trend.
- Wait for a green buy arrow on a closed candle.
- Up trend plus a buy arrow is your buy entry. Enter after the arrow candle has closed.
- A buy arrow while the trend is down is one to skip.

Crash and PainX (sells)
- Look at the Sniper Trend window. Orange dots mean a down trend.
- Wait for an orange sell arrow on a closed candle.
- Down trend plus a sell arrow is your sell entry. Enter after the arrow candle has closed.
- A sell arrow while the trend is up is one to skip.
Use the entry, take profit and stop loss lines (section 8) to plan the trade, and always place your own stop loss.
5. Market mode
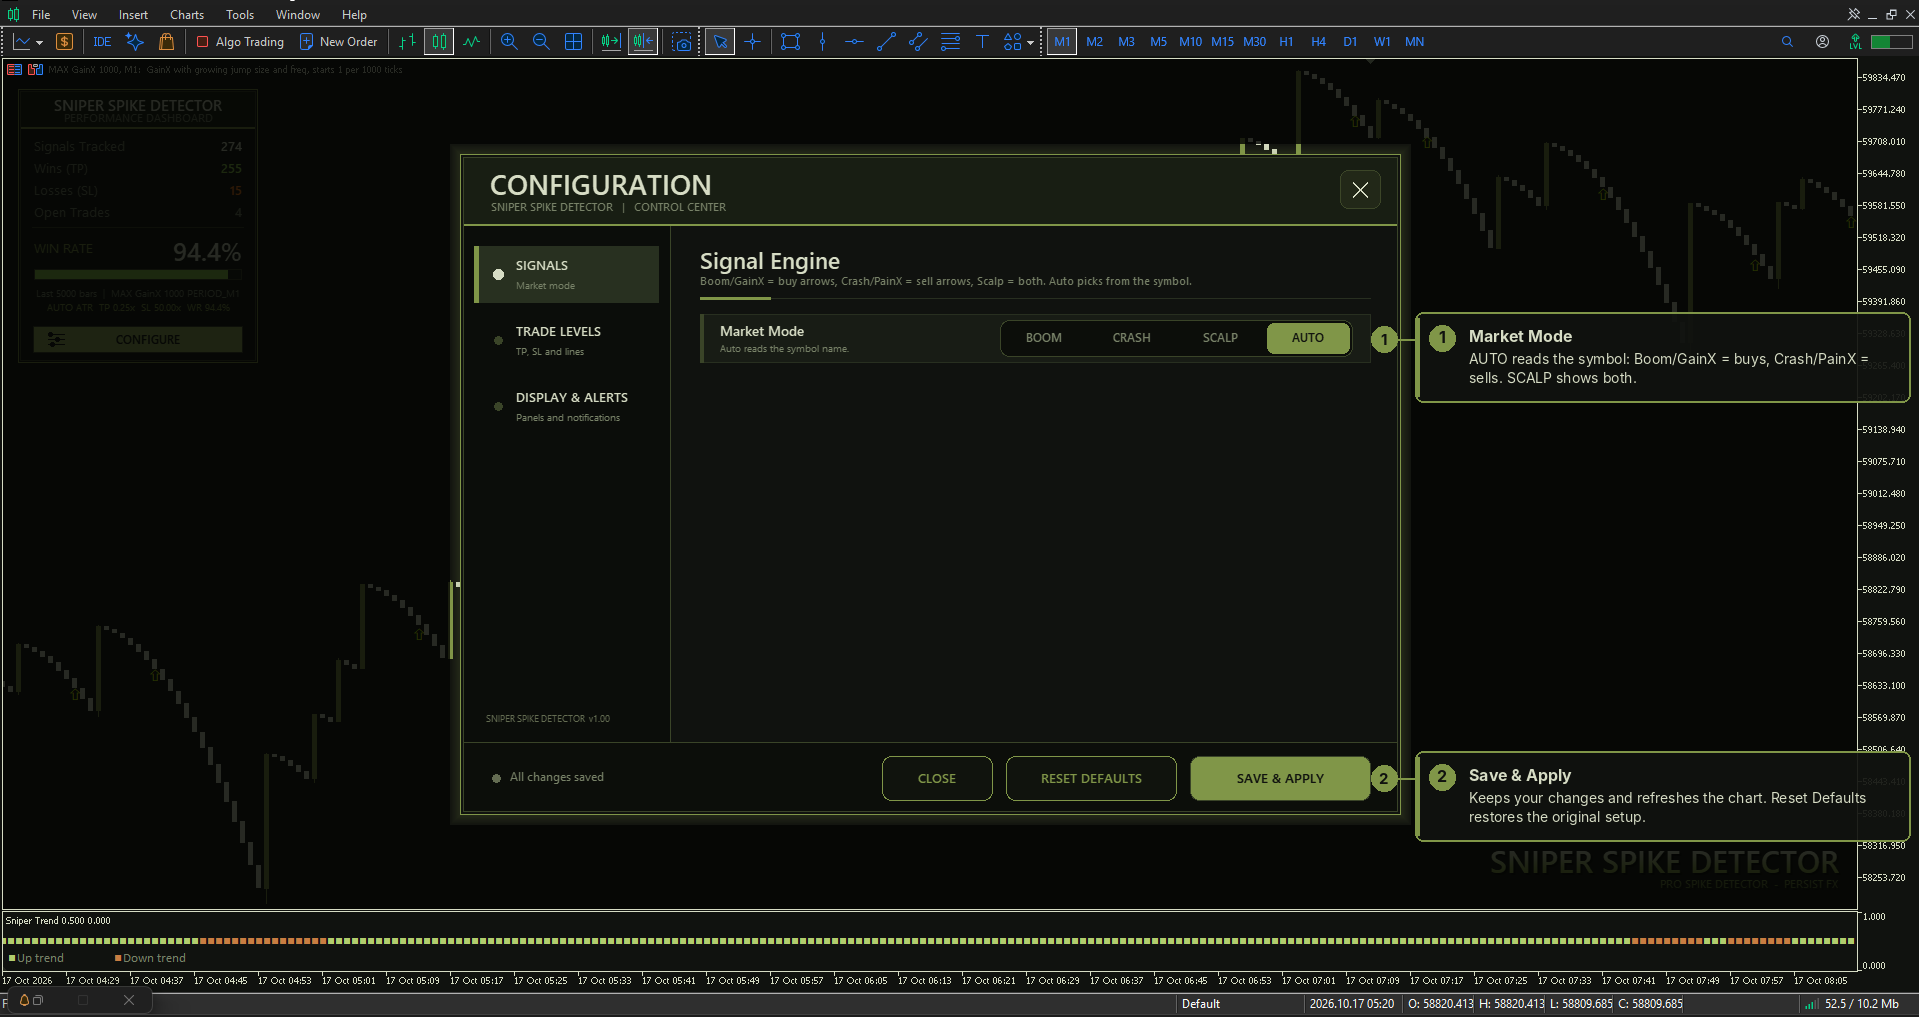
Market mode decides which signals the indicator shows. You change it in the settings menu, on the Signals tab.
- AUTO (default): reads the symbol name. Boom and GainX give buys, Crash and PainX give sells, and any other symbol gives both.
- BOOM: buy arrows only.
- CRASH: sell arrows only.
- SCALP: both buy and sell arrows.
For nearly everyone, AUTO is the right choice. Only change it if you want to see the opposite direction on purpose.
6. The dashboard
The dashboard sits at the top left of the chart and tracks how the signals on your chart have performed.
- Signals Tracked: the number of signals found in the history window.
- Wins (TP): signals that reached take profit first.
- Losses (SL): signals that reached stop loss first.
- Open Trades: signals that have not reached either level yet. They are left out of the win rate.
- Win Rate: wins as a share of the signals that have been resolved.
- The small text underneath shows how many bars are used, the symbol, the TP/SL mode and values, and the win rate again.
- Configure: opens the settings menu.
How the dashboard counts a signal: the trade is taken at the close of the signal candle. If a single candle touches both levels, it counts as a loss.
7. The settings menu
Click Configure on the dashboard. The menu has three pages: Signals, Trade Levels, and Display and Alerts.
- Save and Apply keeps your changes and refreshes the chart.
- Reset Defaults returns everything to the original setup.
- Close leaves the menu.
Your changes are saved, so they are still there the next time you load the indicator.
8. Trade levels: entry, take profit and stop loss
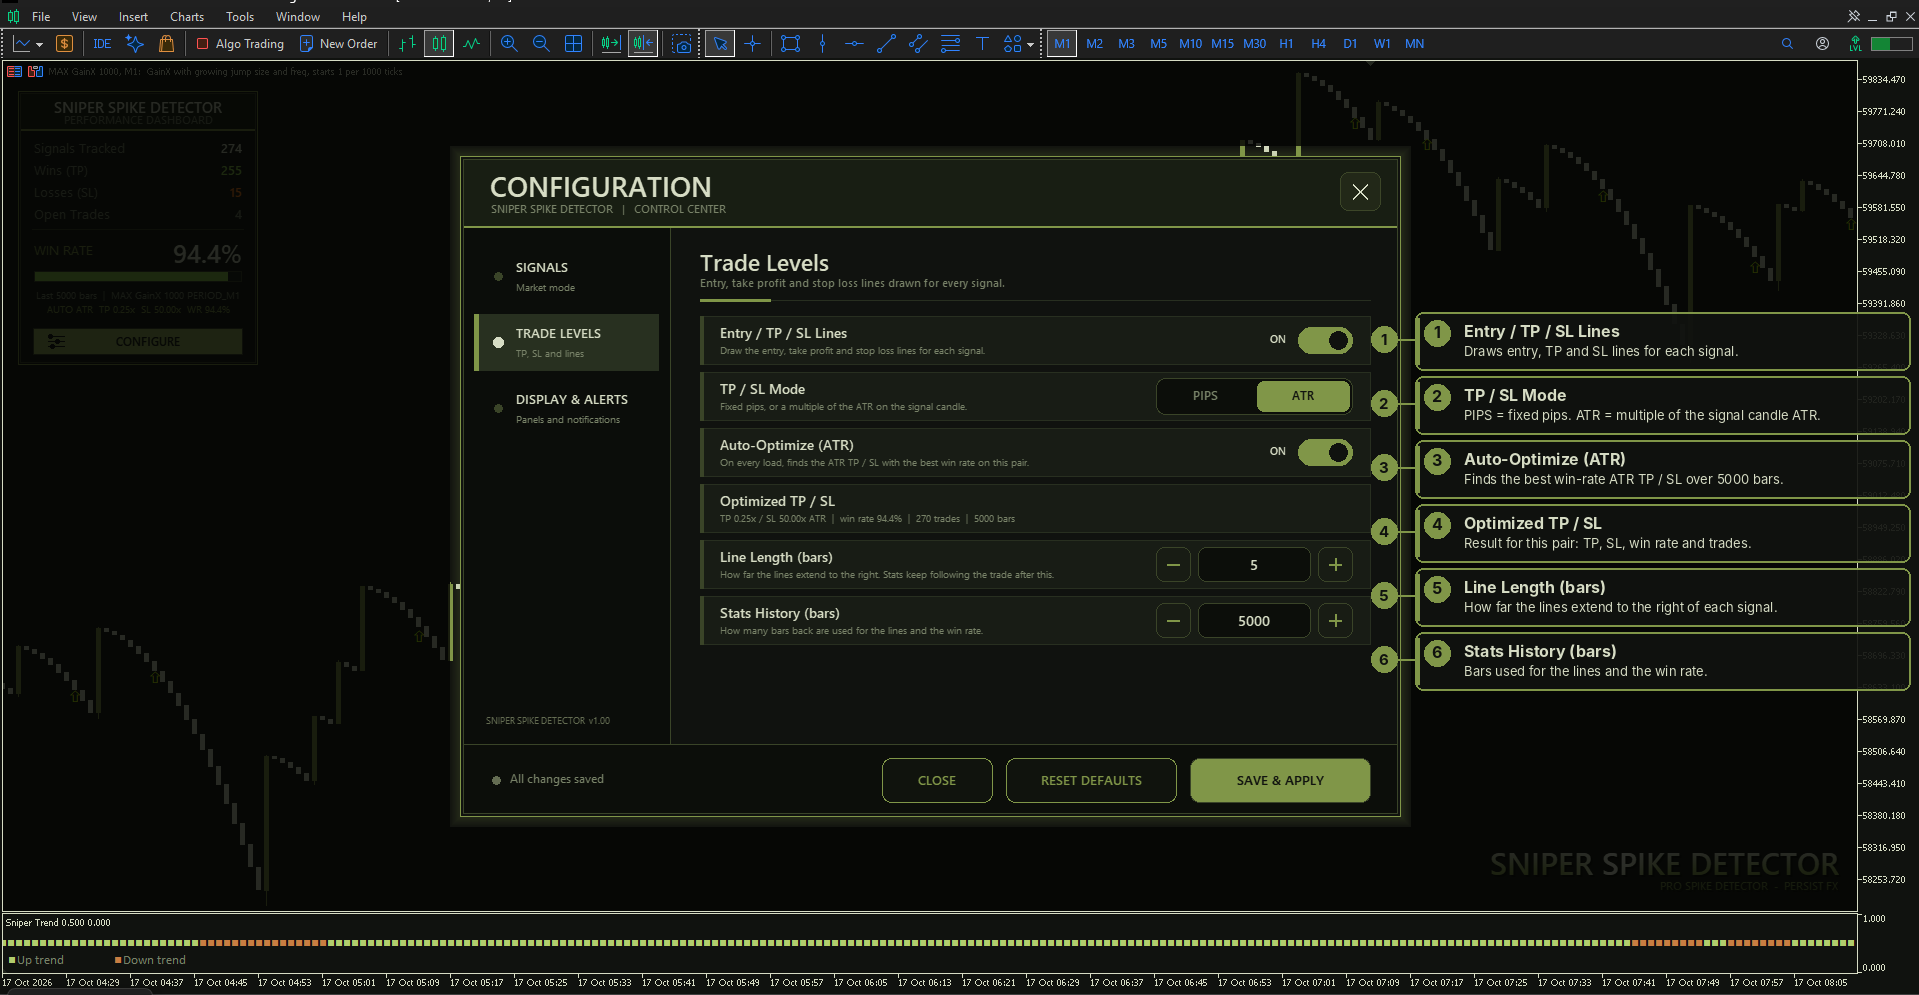
The Trade Levels page controls the lines drawn for each signal and the way TP and SL are measured.
- Entry / TP / SL Lines: draws the entry, take profit and stop loss lines for each signal. On by default.
- TP / SL Mode: PIPS uses fixed pips. ATR uses a multiple of the ATR on the signal candle, so the levels adjust to current volatility. ATR is the default.
- Auto-Optimize (ATR): see section 9.
- Optimized TP / SL: shows the result found for this pair.
- Line Length (bars): how far the lines extend to the right of each signal. Default 5.
- Stats History (bars): how many bars back are used for the lines and the win rate. Default 5000.
In PIPS mode you can also set the take profit and stop loss in pips.
9. Auto-optimize
When Auto-Optimize is on, the indicator tests many ATR take profit and stop loss combinations over the last 5000 bars and picks the pair with the best win rate. It runs every time you load the indicator or press Save and Apply.
- It needs enough history to be reliable. A result needs at least 30 resolved trades to count.
- The result is different for every pair, which is why the Optimized TP / SL row shows the pair's own numbers.
- It is based on past data. It is a good starting point, not a promise about future trades.
Read the result properly. The optimizer ranks by win rate. That often lands on a small take profit and a wide stop loss. A high win rate with a wide stop loss means each loss can be much larger than each win, so look at the TP and SL values and not just the win rate, and size your trades with that in mind.
If you prefer your own levels, turn Auto-Optimize off and set the ATR multipliers, or switch to PIPS mode.
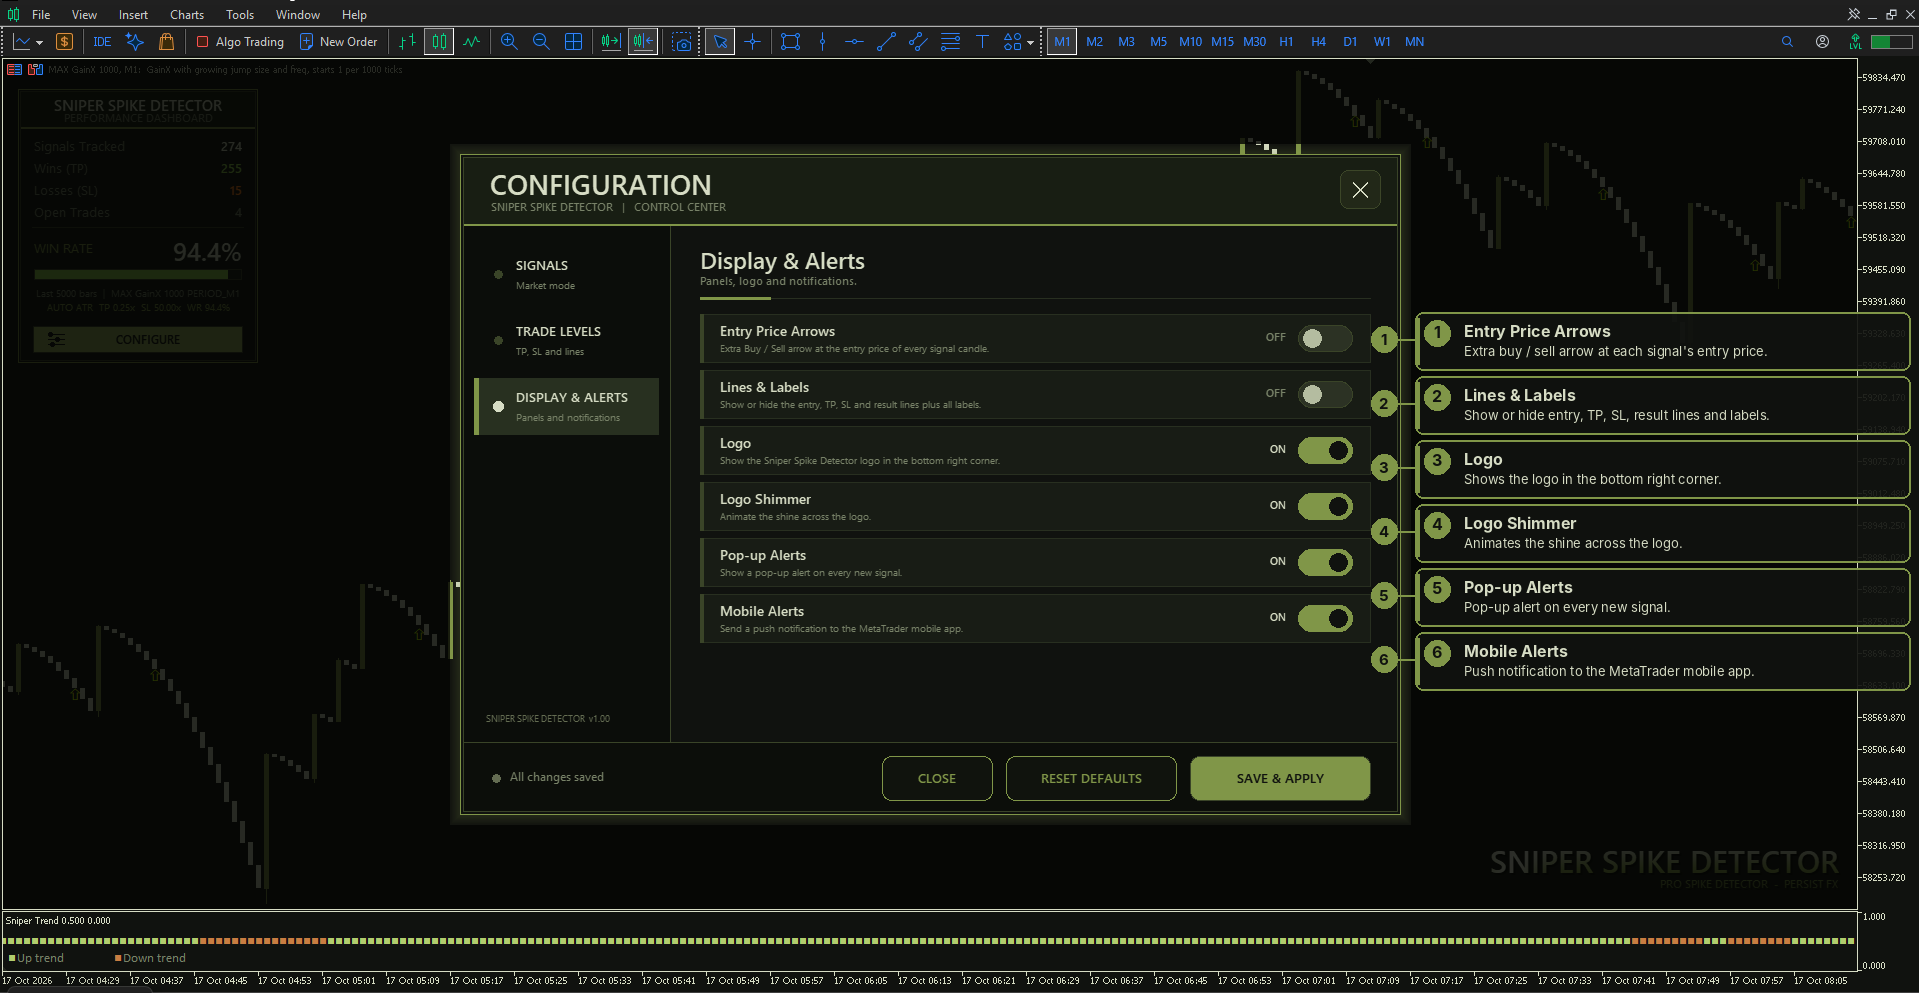
10. Display and alerts
This page controls what appears on the chart and how you are notified.
- Entry Price Arrows: an extra arrow at the entry price of each signal candle. Off by default.
- Lines & Labels: shows or hides the entry, TP, SL and result lines and their labels. Off by default.
- Logo: shows the Sniper Spike Detector logo in the bottom right corner.
- Logo Shimmer: animates the shine across the logo. Turn it off if you want the chart to be completely still.
- Pop-up Alerts: a pop-up alert on every new signal.
- Mobile Alerts: a push notification to the MetaTrader mobile app.
For mobile alerts to work, set up notifications in MetaTrader first: enter your MetaQuotes ID under Tools, Options, Notifications, and enable push notifications.
11. Sniper Trend
Sniper Trend is the window under the chart. It shows a row of dots:
- Green dots: up trend.
- Orange dots: down trend.
Use it together with the arrows, as described in section 4: buys on Boom and GainX only when the trend is up, sells on Crash and PainX only when the trend is down.
It is included with the indicator and loads on its own. If you ever remove the window by accident, remove the indicator from the chart and add it again.
12. Using it in the Strategy Tester
You can run the indicator in the MetaTrader 5 Strategy Tester in visual mode to watch the signals appear.
- Turn on "Visual mode". The Sniper Trend window is added there too.
- The logo shimmer is switched off in the tester.
- Without visual mode there is no chart, so there is nothing to see.
13. Indicator inputs
Most settings live in the Configure menu. The Inputs tab only has a few:
- Pop-up Alerts / Mobile Alerts: the starting alert settings.
- Mode: AUTO, Boom/GainX, Crash/PainX or Scalp.
- ATR period (arrow placement): how the arrow is spaced from the candle. Default 14.
- ATR multiplier (arrow distance): how far from the candle the arrow sits. Default 0.5.
- Apply Stealth Military chart colors: turn off to keep your own chart colours.
14. Tips and common questions
Do the signals repaint?
No. An arrow is drawn after its candle has closed, and it stays.
Why do I only see buy (or sell) arrows?
That is the market mode. On Boom and GainX only buys are shown, and on Crash and PainX only sells. Switch to SCALP to see both.
Why do I see nothing on my chart?
Check you are on a supported pair and the M1 timeframe, and that the chart has enough history loaded. The dashboard needs history to count signals.
Are the entry and TP/SL lines missing?
Lines & Labels is off by default. Turn it on in the Display and Alerts page.
The win rate looks very high. Should I trust it?
Treat it as a description of the past. Look at the TP and SL values behind it (see section 9), test on a demo account, and manage your risk.
Which pairs work best?
It works on all the supported pairs. It has been more accurate on the lower-volatility ones, such as Boom 50 and Crash 50.
Does it work on other timeframes?
It is designed for M1.
I changed settings and they came back after reloading.
Press Save and Apply in the menu so the change is kept.
Questions or support: message me on MQL5.
Trading synthetic indices carries risk and may not be suitable for all traders. Past performance is not indicative of future results. Always test on a demo account before using a live account. The developer is not liable for any trading losses incurred. Trade responsibly.



