Bitcoin Interval: a trend robot in the 2022 bear year, measured on its own

Every trend robot looks good in a year when its market trends up. The year a buyer should ask about is the other one. For Bitcoin that was 2022, the bear year. So instead of the whole test window, which can hide a bad year inside a good total, this article opens 2022 on its own and puts it next to the other six, using our own Bitcoin Interval as the example.
What the robot asks before it trades
Bitcoin Interval trades BTCUSD only, about sixty trades a year, and it reads calendar windows rather than the tick stream. When a window closes it asks three questions in order. How far did price travel across the window, measured against recent volatility rather than a fixed number of points? Did that move hold inside the window, or was it given back before the window ended? Does the daily trend point the same way?
Only when all three agree does it enter, at the market, on the bar after the window closes. There is no pending order sitting on a level and no price trigger to be spiked through. The stop goes out with the entry and every position carries a hard time limit.
None of those questions is "is Bitcoin going up". Over the whole test the robot took 226 long trades, 49.56% of them winners, and 171 short trades, 43.86% winners. Both sides were left in. Neither was switched off after the fact.
2022, measured on its own
Each calendar year was measured as its own test, default package, 3000 USD. In 2022 the robot made +14.7% on 60 trades, at a profit factor of 1.28 and a worst equity drawdown of 11.36% inside the year.
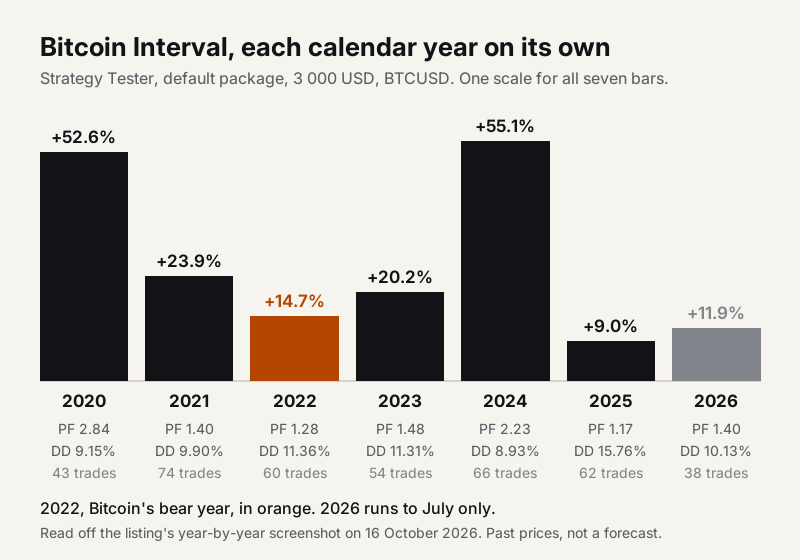
Two things in the figure are worth more than the 2022 number itself. First, 2022 is the second thinnest full year, not the thinnest. The thinnest is 2025: +9.0% at a profit factor of 1.17, with the deepest drawdown of any single year, 15.76%. In this test the hardest year for a trend robot on Bitcoin was not the falling one.
Second, the good years are far from even: +52.6% in 2020 and +55.1% in 2024, against +14.7% and +9.0%. A buyer who expects the average every year will spend most years disappointed. The whole window, January 2020 to August 2026, comes to +412.7% at a worst equity drawdown of 16.77% and a profit factor of 1.50, and it is made of very uneven years.
What this does not prove
A year table starts on 1 January. Your account did not. Every calendar year being positive says nothing about a start in the middle of a year, and the drawdown inside one year can carry into the next.
One feed, one robot. Every figure here was measured with Bitcoin Interval alone on the account, on one broker's data. On the four other brokers we measured, the return landed 12 to 34 percent below the reference feed.
One path. 2022 happened once. The same rules on a different bear year could do better or worse, and a backtest describes how fixed rules behaved on prices that have already happened.
How to check it yourself
The free demo runs in your own Strategy Tester on your own broker's data. Set the dates to 1 January 2022 and 31 December 2022, default settings, and compare your report with the row above. Your broker's result, not ours, is the one your account would have seen.
Bitcoin Interval is 199 USD on the MQL5 Market, with the full year-by-year table and the rest of the measurements on the product page: https://www.mql5.com/en/market/product/193069


