How to find the buffer number of any indicator in MetaTrader 5

Every tool that turns an indicator into alerts or trades asks the same question: which buffer holds the signal? The answer is a small number - 0, 1, 2 - but the indicator does not show it anywhere, and for an indicator bought on the Market there is no source code to look it up. Here are three ways to find it, from the quickest to the most complete.
1. The Data Window (Ctrl+D)
Open the Data Window and move the mouse over a bar with an arrow. Every value the indicator draws is listed under its name, in the order of its buffers: the first line is buffer 0, the second buffer 1, and so on. On a bar with an upper fractal you see a value in the first line and nothing in the second; on a bar with a lower fractal it is the other way round.
The limits: the Data Window shows only the buffers that are drawn. Colour buffers (the colour of Heiken Ashi candles, of a two-colour moving average) and calculation buffers are hidden, and their numbers shift the ones you see. If an indicator has a colour buffer, the count in the Data Window is wrong from that point on.
2. A free script that labels the arrows
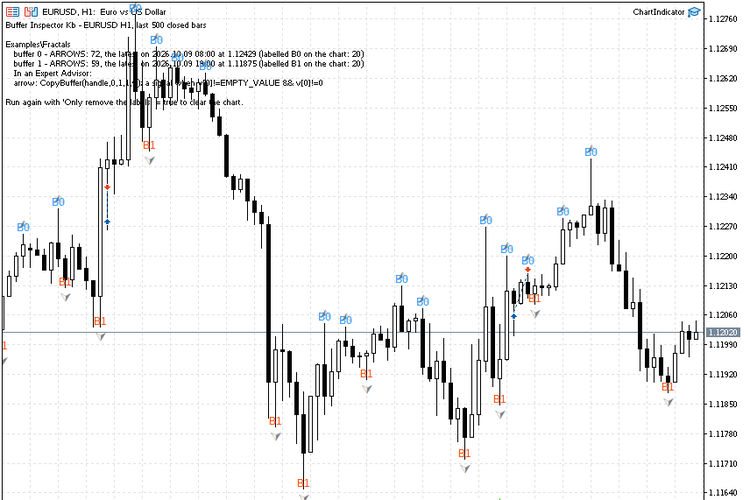
Buffer Inspector Kb is free, with source code, in the Code Base. Drop it on a chart that already has your indicator: it reads every buffer of every indicator on the chart, including the hidden ones, and writes the buffer number right next to the arrows - B0 above the upper fractals, B1 below the lower ones. For lines it shows the current value and the range, for colour buffers the colour numbers, so you see at once that the colour of Heiken Ashi is buffer 4 with the values 0 and 1.
3. A panel that keeps the map in front of you
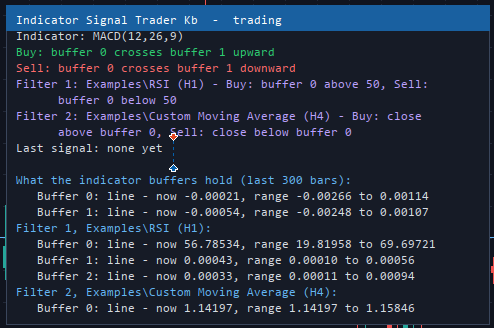
Indicator Signal Trader Kb and the free Indicator Signal Alerts Kb do the same scan when you attach them to a chart and keep the result on their panel: "Buffer 0: ARROWS - 46, the latest on ...", "Buffer 1: ARROWS - 37 ...". You choose the rule - an arrow appears, a level is crossed, one line crosses another, a colour changes - and type the number from the panel. Both also offer ready setups for the built-in indicators in the first line of their inputs.
The built-in indicators, for reference
| Indicator (MQL5\Indicators\Examples) | Buffers |
|---|---|
| Fractals | 0 upper fractals (Sell), 1 lower fractals (Buy) - arrows, confirmed 2 bars later |
| MACD | 0 MACD line, 1 signal line |
| RSI | 0 RSI |
| Stochastic | 0 %K (main), 1 %D (signal) |
| CCI | 0 CCI |
| ADX | 0 ADX, 1 +DI, 2 -DI |
| Bollinger Bands (BB) | 0 middle, 1 upper, 2 lower |
| Alligator | 0 jaw, 1 teeth, 2 lips |
| Ichimoku | 0 Tenkan-sen, 1 Kijun-sen, 2 Senkou Span A, 3 Senkou Span B, 4 Chikou Span |
| Heiken Ashi | 0-3 open, high, low, close; 4 colour (0 rising, 1 falling) |
| Awesome Oscillator | 0 value, 1 colour (0 rising, 1 falling) |
| Parabolic SAR | 0 SAR dots |
When there is no buffer at all
If the Data Window is empty, the script finds no arrow buffer and yet you see arrows on the chart, the indicator draws them as chart objects. No program can read such arrows through the indicator, so neither an Expert Advisor nor an alert tool will see them. The only way out is a version of the indicator that writes its arrows to a buffer - worth asking its author about before buying.