Confluence Indicator for MT4 and MT5: How a 16-Point Score Filters Range-Filter Buy and Sell Signals

1. Introduction
Every arrow indicator answers one question: has the trend changed? Few answer the question a trader needs next: how much evidence stands behind that change? That gap is why I wanted a confluence indicator for MT4 and MT5 that does not stop at the arrow. It should count the evidence, show the count, refuse to fire while the market moves sideways, and keep telling me after the entry whether the trend still supports the trade.
This guide explains confluence trading from the ground up, with FXB Confluence Engine as the worked example. You will see what a range filter indicator does, how a ten-layer confluence score adds up to 16 points at the default settings, which gates a signal has to pass before it prints, and how to read the multi-timeframe dashboard section by section. The second half is practical: a six-step workflow with an honest exit plan, real chart examples, measured signal counts and a full parameter reference.
One point up front, because it shapes everything else: the indicator does not trade, and it does not draw a stop loss or a take profit. It gives you a direction, a score and a set of reference levels. The exit plan is yours, and section 13 shows how to build it from what is already on the chart.
The indicator is available on the MQL5 Market for both platforms:
- MetaTrader 5: FXB Confluence Engine MT5
- MetaTrader 4: FXB Confluence Engine MT4
2. What Confluence Is, and Why Single-Indicator Arrows Fail
Confluence means several independent pieces of evidence pointing the same way at the same time. A trend change on its own is one piece. A trend change while the fast average sits above the slow one, momentum agrees, the higher timeframe agrees and volume is at least average is five. Confluence trading is the habit of waiting for the second situation and skipping the first.
Single-indicator arrows fail for three reasons:
They fire in every market regime. A moving-average or oscillator cross does not know whether the market is trending or drifting sideways. In a range it flips back and forth, and every flip looks like the one that started a real move.
They carry no weight. A turn with the higher timeframe, momentum and volume behind it looks identical to a turn with nothing behind it, and you are left to judge the difference by eye.
They go quiet after the entry. Whether the trend you entered on still exists twenty bars later is left to you.
A useful confluence tool therefore needs four things: a clean trend definition that produces candidates, a score that weighs the evidence behind each one, filters that refuse candidates in sideways conditions, and a way to keep watching after the signal.
3. The Range Filter: A Trend Line That Ignores Small Moves
The trend in FXB Confluence Engine comes from a range filter. The filter line moves only when price travels further than an ATR-sized range away from it. Smaller moves are ignored, so the line stays flat through minor noise and steps up or down when price makes a move large enough to matter. When the line turns up, the trend is bullish; when it turns down, the trend is bearish. Throughout this article, "the trend" means the direction of this line.
Because the range is built on the Average True Range, it adapts to each instrument and timeframe. Three inputs set it:
- Sensitivity (default 6) sets the width. Higher values widen the range, so the trend flips less often and signals are rarer; lower values flip sooner. The width scales with Sensitivity / 8.
- ATR Length (default 14) is the ATR period behind the filter width and the trailing band.
- ATR Multiplier (default 0.8) scales both the filter width and the four-layer trailing band.
Around the line the indicator draws a trailing band of four shaded layers on each side, coloured by the trend, and Paint Bars colours the candles teal in an up-trend and red in a down-trend.
On its own, though, a range filter indicator is still just a line that turns. Every turn is a candidate. Whether a candidate becomes a BUY or a SELL depends on the score and the gates.
4. Introducing FXB Confluence Engine, a Confluence Indicator for MT4 and MT5
FXB Confluence Engine is the tool I built to put all of this on one chart. It runs on MetaTrader 4 and MetaTrader 5 with an identical engine: the same signals, the same score and the same dashboard values. The visible difference is cosmetic. MT4 draws the band and the candles with histogram bars and shows ^ v + x on the dashboard where MT5 shows arrows and ticks.
What it gives you:
- A range filter trend line with a four-layer trailing band and trend-coloured candles.
- Non-repainting buy and sell signals, evaluated on closed bars and drawn as a diamond with BUY or SELL text.
- A confluence score out of 16 at the defaults, from ten layers including a chop penalty, banded HIGH, MED, LOW or WEAK.
- A chop filter (ADX, Choppiness Index, signal cooldown) plus RSI and volume confirmation, with optional VWAP, candle and EMA distance checks.
- A multi-timeframe dashboard and a bottom strip with the trend on five timeframes and the filter at five sensitivities.
- Pivot levels (Classic, Fibonacci or Camarilla) with the nearest support and resistance on the dashboard.
- Ten alert families over four channels.
Every value the engine computes was compared with the original design's own output, bar by bar, on both builds: 6,922,033 values per platform, with no differences. The dashboard text and the pivot labels were compared the same way. On broker data, the indicator's incremental updates equal a fresh full recalculation (3,000 bars x 140 values per chart, zero differences).
Both versions are on the MQL5 Market:
- MetaTrader 5: FXB Confluence Engine MT5
- MetaTrader 4: FXB Confluence Engine MT4
5. The Confluence Score: Ten Layers, 16 Points
On every bar the indicator scores the current trend direction across ten layers. Each layer adds points when it agrees with the trend; the chop penalty takes points away. At the default settings the maximum is 16. When the trend turns, the score of that closed bar is the one that counts for the signal.
| Layer | Points | What earns the points |
|---|---|---|
| EMA + Momentum | up to 4 | Fast EMA against slow EMA, price against the fast EMA, and momentum (rate of change over 5, 10 and 20 bars) agreeing with the trend |
| Multi-timeframe | up to 4 | How many of M5, M15, H1 and H4 agree with the trend on this chart |
| Sensitivity | up to 3 | The same filter at sensitivity 12 (two points) and 16 (one point) agreeing |
| HTF Bias | up to 1 | The higher timeframe agreeing |
| Volatility | up to 2 | One point each when ATR and ATR as a share of price are not at the top of their last 60 bars |
| RSI | up to 1 | RSI on the trend's side of its threshold |
| Volume | up to 1 | Volume at or above its average |
| VWAP | up to 1 | Price on the trend's side of VWAP (off by default) |
| Candle | up to 1 | An engulfing or strong-body candle (off by default) |
| Chop penalty | 0 to -2 | Minus one when ADX is below its threshold, minus one when the Choppiness Index is above its maximum |
The layers ask different kinds of question on purpose. EMA + Momentum checks the averages and the recent rate of change. Multi-timeframe and HTF Bias check the bigger picture. Sensitivity asks whether slower, wider versions of the same filter point the same way, which separates a small wiggle from a broader turn. Volatility rewards conditions that are not stretched, so a turn that arrives while ATR sits at the top of its last 60 bars scores lower. RSI and Volume add momentum and participation.
The chop penalty is the counterweight. When ADX says the market lacks direction, or the Choppiness Index says price is moving sideways, the score loses a point for each, so a turn in a sideways market needs extra agreement elsewhere to reach the score of a turn in a clean trend.
Bands. The score appears as n/max with a band: HIGH from 80 percent of the maximum, MED from 57 percent, LOW from 43 percent and WEAK below that. On the measured charts in this article, 13/16, 14/16 and 15/16 read HIGH, 10/16 and 12/16 read MED, 8/16 and 9/16 read LOW, and 6/16 and lower read WEAK.
The maximum follows your settings. Switching a layer off removes it from the maximum. Switching VWAP or Candle on adds one point to the score and one to the maximum. Because the bands are percentages, they stay meaningful whichever layers you use.
Minimum Signal Strength (default 8) is the floor: a turn that scores below it is not shown. Raising it is the simplest way to see fewer signals, each with more layers behind it.
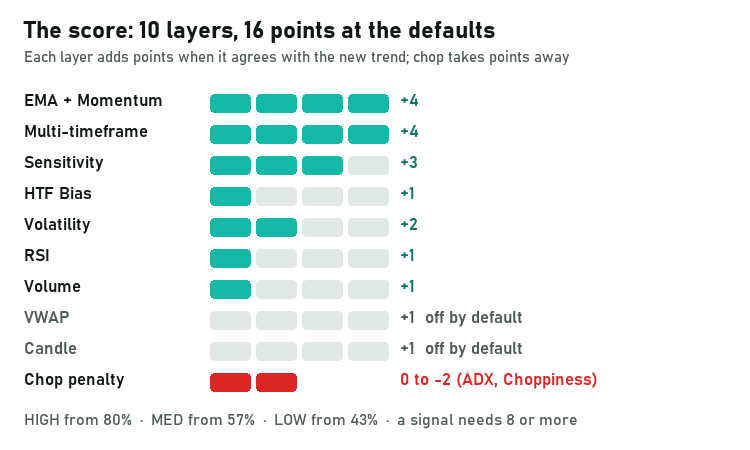
Figure 1. The ten layers of the confluence score. Seven are on by default and add up to 16, VWAP and Candle are optional, and the chop penalty can take two points away.
6. The Gates a Signal Must Pass
The score weighs a turn. The gates decide whether it is allowed at all. A signal prints only when the range filter turns on a closed bar and every enabled gate is open on that same bar:
- EMA alignment, when Only show signals when EMA aligned is on (default On). A BUY needs the fast EMA (60) above the slow EMA (200), price above the fast EMA and the fast EMA rising; a SELL needs the mirror image. This filters the signal itself, not only the display.
- The chop gate: ADX at or above ADX Threshold (20.0), the Choppiness Index at or below Choppiness Max (61.8), and the cooldown clear, meaning Cooldown Bars (5) have closed since the previous signal. All three parts are on by default.
- RSI: a BUY needs RSI at or above RSI Min for Longs (50.0), a SELL at or below RSI Max for Shorts (50.0).
- Volume: the bar's volume at or above its 20-bar average times the multiplier (1.0). MetaTrader forex volume is tick volume.
- VWAP (off by default): a BUY needs price above the daily VWAP, a SELL below it.
- Candle pattern (off by default): an engulfing or strong-body candle in the signal's direction.
- EMA distance (off by default): no signal when price is further than 2.0 ATRs from the fast EMA, so late entries far from the mean are skipped.
- Minimum Signal Strength: a score of at least 8.
If the trend turns while any gate is shut, that turn produces no signal. The line still turns and the candles still change colour, but no diamond appears, and the CONFIRMATIONS block of the dashboard (or the score, for the strength floor) shows what held it back. This is why you will see trend changes on the chart without a signal: they are the turns the gates refused. The ADX and Choppiness parts of the chop filter exist to keep sideways flip-flops off the chart.
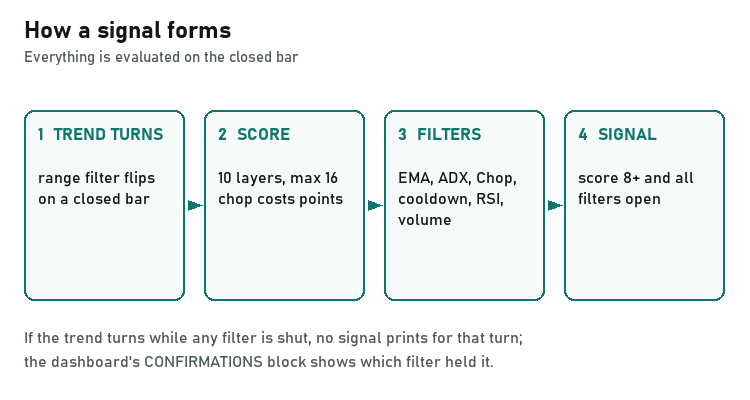
Figure 2. A signal needs the trend turn, the score and every enabled filter on the same closed bar.
What repaints and what does not
"Non-repainting" is often claimed loosely, so here is the exact split.
Fixed once the bar closes: the signals, the score, the filters and the alerts. All of them are evaluated on the closed bar. A BUY or SELL diamond that has printed stays where it is, with the score it printed with, and an alert that has fired refers to a bar that can no longer change.
Moving on the forming bar: the filter line, the trailing band, the candle colour and the dashboard. While the current bar is open they follow price, so the line can step, the band can shift and the candle can change colour before the close. Treat anything on the forming bar as provisional; the decision is made when it closes.
That split is what makes non-repainting buy and sell signals usable in practice: you get a live view of the developing bar without the signals themselves being rewritten.
7. Reading the Multi-Timeframe Dashboard, Section by Section
The dashboard sits in the top right corner by default and reads top to bottom like a checklist. It updates on the forming bar, so its values can change until the bar closes.
- TREND / HTF: the trend on this chart (BULLISH or BEARISH) and the higher-timeframe bias.
- PRICE / ATR: the current price and the ATR reading.
- SIGNAL QUALITY: the score as n/max, its band, a 14-cell bar and the percentage of the maximum.
- SCORE BREAKDOWN: the points of each layer, plus Chop Pen. for the penalty. This is where you see what is missing.
- CONFIRMATIONS: EMA Aligned, the RSI value, Volume Above or Below Avg, the VWAP side, Chop Gate OPEN or BLOCKED, the ADX value, the Chop Idx value, Cooldown Ready or counting, EMA Dist and Candle.
- MARKET DATA: EMA 60 and EMA 200 with their slope, Near Sup and Near Res from the pivots, VWAP and Day Rng %.
- SESSION and Volatility: London (08:00 to 16:00 London time), New York (09:30 to 16:00 New York time), the LDN+NY overlap, Asian (00:00 to 09:00 Tokyo time) or Off-Hours, with daylight saving handled; beside it, volatility as LOW, MED or HIGH with the ATR percentile.
- LAST SIGNAL: Direction, Bars Ago and Score at Signal.
- TRADE STATUS: Signal vs Trend reads ALIGNED, Hold Position while the trend still matches the last signal, or REVERSED, Consider Exit once it has turned against it. A plain-words line follows, such as "Trend supports LONG, manage TP/SL" or "Trend now BEARISH, close LONG or tighten SL", then a tip line: High conviction, Moderate, Low confluence or Weak signal.
Two numbers are easy to confuse. SIGNAL QUALITY is the score now, for the current trend. Score at Signal is the score the last signal printed with. They can be far apart, and both matter.
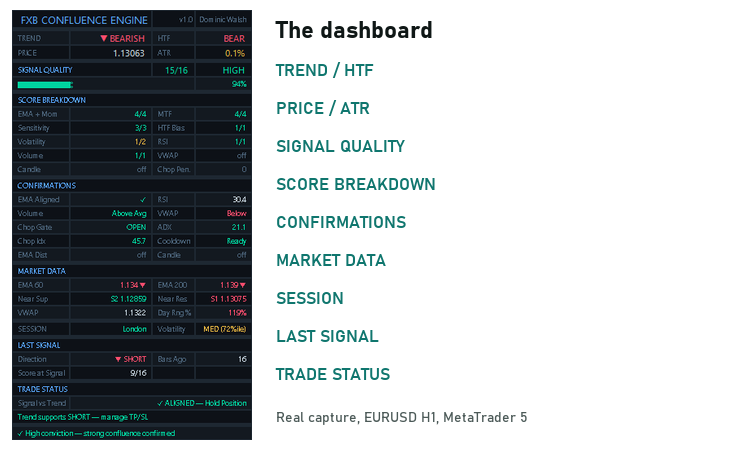
Figure 3. The dashboard and its nine sections, captured on EURUSD H1 in MetaTrader 5.
8. Multi-Timeframe Agreement and the Bottom Strip
Two layers look beyond the current chart. Multi-timeframe counts how many of M5, M15, H1 and H4 agree with the trend on your chart, for up to 4 points. HTF Bias checks the timeframe set in HTF Timeframe (default M30) for one more point, and its result also fills the HTF cell on the top row of the dashboard.
The bottom strip shows where these points come from:
- MTF shows the trend on M1, M5, M15, H1 and H4. M1 is marked with an asterisk: it is context only. M5 to H4 score up to 4.
- SENS shows the same filter at sensitivity 3, 5, your own setting (marked with a star), 12 and 16. The 3 and 5 cells are context; 12 and 16 score up to 3.
The middle cell shows MTF score / sensitivity score, so 4/3 means all four scoring timeframes and both scoring sensitivities agree with the trend. A bearish turn on H1 with the strip pointing down from M5 through H4 is a different proposition from the same turn with the strip split down the middle.
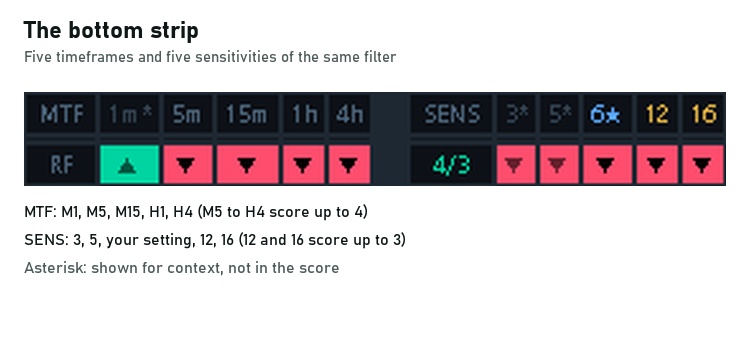
Figure 4. The bottom strip. Cells marked with an asterisk are shown for context and are not in the score.
9. Pivot Levels
Pivots give the trade a map. The indicator draws the pivot point with R1 to R4 and S1 to S4 of the previous completed period: the previous day by default (Pivot Timeframe D1), or the previous week or month. The formula is Classic by default, with Fibonacci and Camarilla as alternatives. Lines begin 100 bars before the start of the current period, labels show each level's name and price in the symbol's own number of decimals, and a level changes colour once price breaks it.
The nearest support and resistance appear on the dashboard as Near Sup and Near Res; switching Show Pivot Levels off also blanks those two rows. Pivots are not part of the score. Their job is in the exit plan, where the nearest level in the trade's direction is the first target reference.
10. Alerts: Ten Families, Four Channels
Alerts are evaluated on closed bars, once per bar, and never for history or in the Strategy Tester. Ten families sit under one master switch (Enable alerts, default On). Two are on by default: BUY and SELL signals, and Trade invalidated. The other eight start off: Strong signals (score 80%+), EMA-confirmed signals, Trend change, Chop gate opened / closed, HTF bias change, RSI enters overbought / oversold, Volume spike, and Score crosses the minimum.
They go out over four channels: the popup window (On), sound (On), push notification (Off) and e-mail (Off). The sound plays only when the popup is off, because the popup has its own sound. Push notifications need your MetaQuotes ID in Tools > Options > Notifications; e-mail uses the terminal's settings in Tools > Options > Email.
The messages use one compact format that reads well on a phone:
FXB-CE LONG | EURUSD | H1 | Price: 1.16377 | Score: 12/16 (MED) | HTF: BULL | RSI: 52.2 | Vol: Above Avg FXB-CE TRADE INVALIDATED | EURUSD | H1 | Close LONG - trend reversed to BEARISH | Price: 1.16102 FXB-CE TREND CHANGE | EURUSD | BEARISH | H1
If you only want the HIGH band, switch on Strong signals (score 80%+) and switch off BUY and SELL signals. Keep Trade invalidated on: it fires when the trend reverses against the last signal, the moment a position from that signal needs a decision.
11. How Often It Fires
Counting signals is a useful sanity check. The counts below cover the last 1,000 closed bars on each chart with default inputs; the second figure switches off only Only show signals when EMA aligned.
- MetaTrader 5, 20 charts on a broker demo feed (MT5 build 6230, price data to 1 October 2026): 5 to 14 signals with the defaults, 9 to 24 with the EMA filter off.
- MetaTrader 4, 13 charts (MT4 build 1479, data to 7 October 2026): 3 to 13 signals with the defaults.
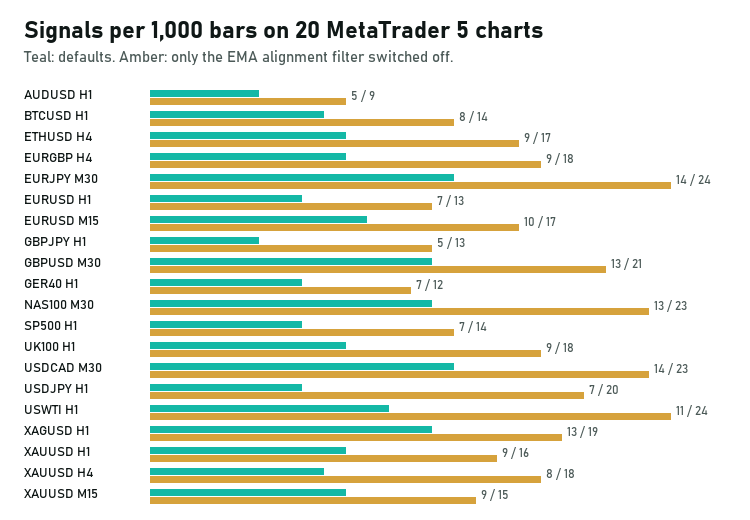
Figure 5. Signals per 1,000 closed bars on 20 MetaTrader 5 charts. Teal: defaults. Amber: only the EMA alignment filter switched off.
Two things stand out. Switching off a single filter, EMA alignment, raises the count on every one of the 20 charts, so the gates do real work. And the defaults are selective: 5 to 14 signals in 1,000 bars leaves long stretches without one, which is the point of a confluence trading approach.
Read the counts for what they are. A count says how busy a chart is, not how many signals work. A chart with 14 signals is not better or worse than a chart with 5; it simply asks you for more decisions.
12. A Practical Confluence Trading Workflow
Here is a six-step routine that uses each part of the indicator for what it is designed to do. It is a framework, not a rule set; test any version of it on your own instruments first.
Step 1: Context. Before any signal, read the top of the dashboard and the bottom strip. Does the HTF bias agree with the trend? How many scoring timeframes and sensitivities agree? Is the chop gate OPEN or BLOCKED, and what do the session and volatility rows say?
Step 2: Signal. Wait for the diamond on the closed bar; anything on the forming bar is provisional. If you work from alerts, the BUY and SELL alert arrives after the close with the price, the score, the HTF bias, RSI and volume in one line.
Step 3: Score. Read SIGNAL QUALITY and SCORE BREAKDOWN. Which layers are missing? A 9/16 that lacks the multi-timeframe points is a different trade from a 9/16 that lacks the volatility points. Decide in advance which bands you trade, for example HIGH only, or MED when the HTF bias agrees, and write it down.
Step 4: Stop. The indicator draws no stop loss. Three references on the chart work as stop locations: beyond the filter line, beyond the outer edge of the trailing band, or beyond the extreme of the signal bar (its low for a BUY, its high for a SELL). Take the values from the closed bar, since the line and band can still move on the forming bar. Choose one reference, apply it every time, and size the position from the stop distance.
Step 5: Target. The indicator draws no take profit either. The first reference is the nearest pivot in the trade's direction: Near Res for a BUY, Near Sup for a SELL. Compare that distance with your stop distance before entering. If the nearest level is very close to the entry, the trade has little room before it meets a level other traders also watch, which is a reason to skip it or plan a partial exit there.
Step 6: Manage. Watch TRADE STATUS. ALIGNED, Hold Position means the trend that produced the signal is still in place. REVERSED, Consider Exit means it has turned against your position, and the plain-words line says so directly. The Trade invalidated alert fires on the closed bar where that happens, so you do not have to watch the chart. A REVERSED reading in the middle of a bar is provisional until the close. Some traders also trail the stop behind the filter line as it steps in their favour.
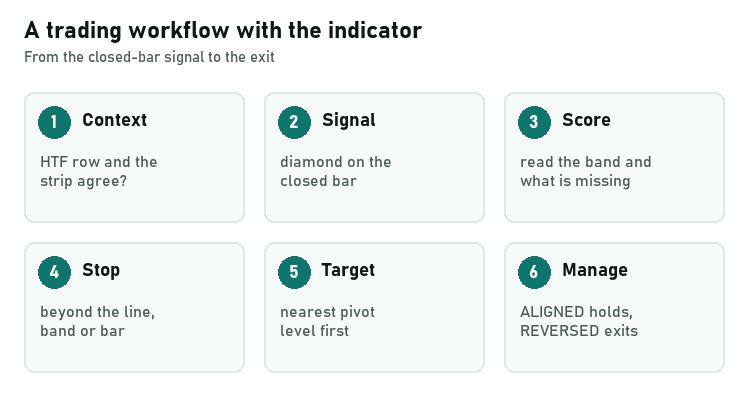
Figure 6. The six-step workflow, from the closed-bar signal to the exit.
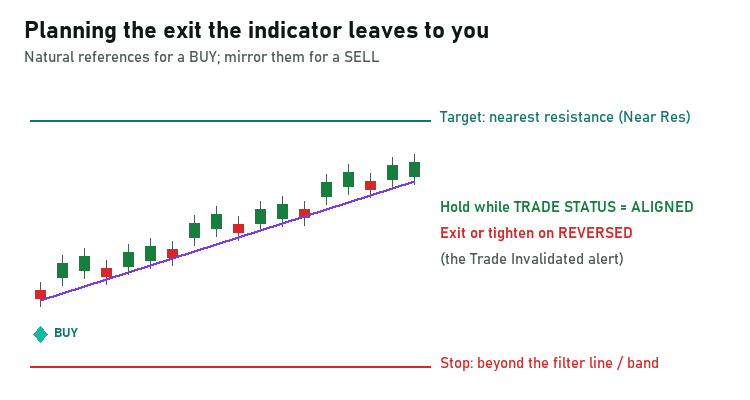
Figure 7. The exit plan for a BUY: stop beyond the filter line or band, first target at the nearest resistance, hold while ALIGNED, exit or tighten on REVERSED. Mirror it for a SELL.
13. Real Chart Examples
The captures below are real charts with the indicator at its default inputs, nine from MetaTrader 5 and one from MetaTrader 4. Each subsection reports what the dashboard showed at the moment of capture. They show how to read the indicator; they are not records of trades.
EURUSD H1, MetaTrader 5
The trend is bearish and the score now is 15/16, in the HIGH band. The last signal was a SHORT 16 bars before the capture, printed with a score of 9/16, and TRADE STATUS reads ALIGNED, Hold Position. The red band, the stepping filter line, the labelled daily pivot lines and the bottom strip are all visible.
EURUSD M15, MetaTrader 5
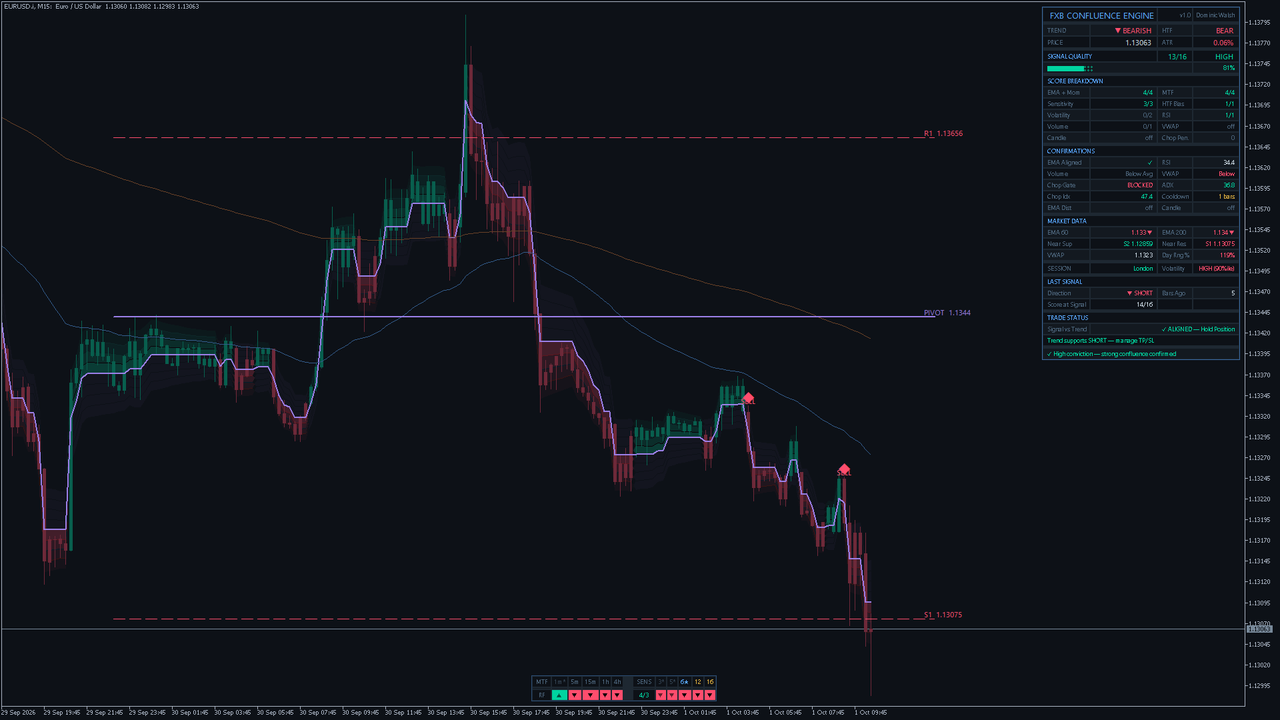
A young signal: the last SHORT printed 5 bars before the capture, with a score of 14/16. The trend is still bearish, the score now is 13/16 HIGH, and TRADE STATUS reads ALIGNED, Hold Position. The signal sits close to the right edge of the chart, with the red band and the falling filter line around it.
GBPUSD M30, MetaTrader 5
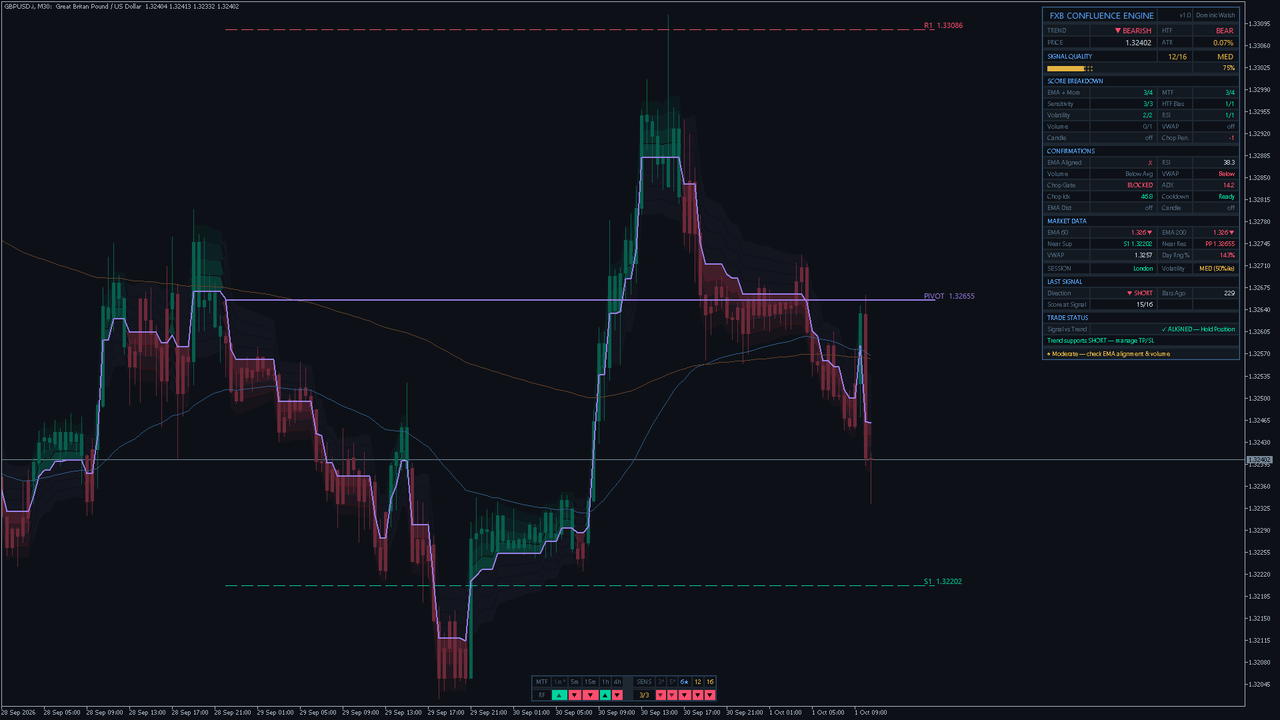
The trend is bearish with a score now of 12/16, in the MED band. The last signal was a SHORT 229 bars ago that printed at 15/16, and TRADE STATUS still reads ALIGNED, Hold Position. Bars Ago tells you how long the trend has run without a new signal.
USDJPY H1, MetaTrader 5
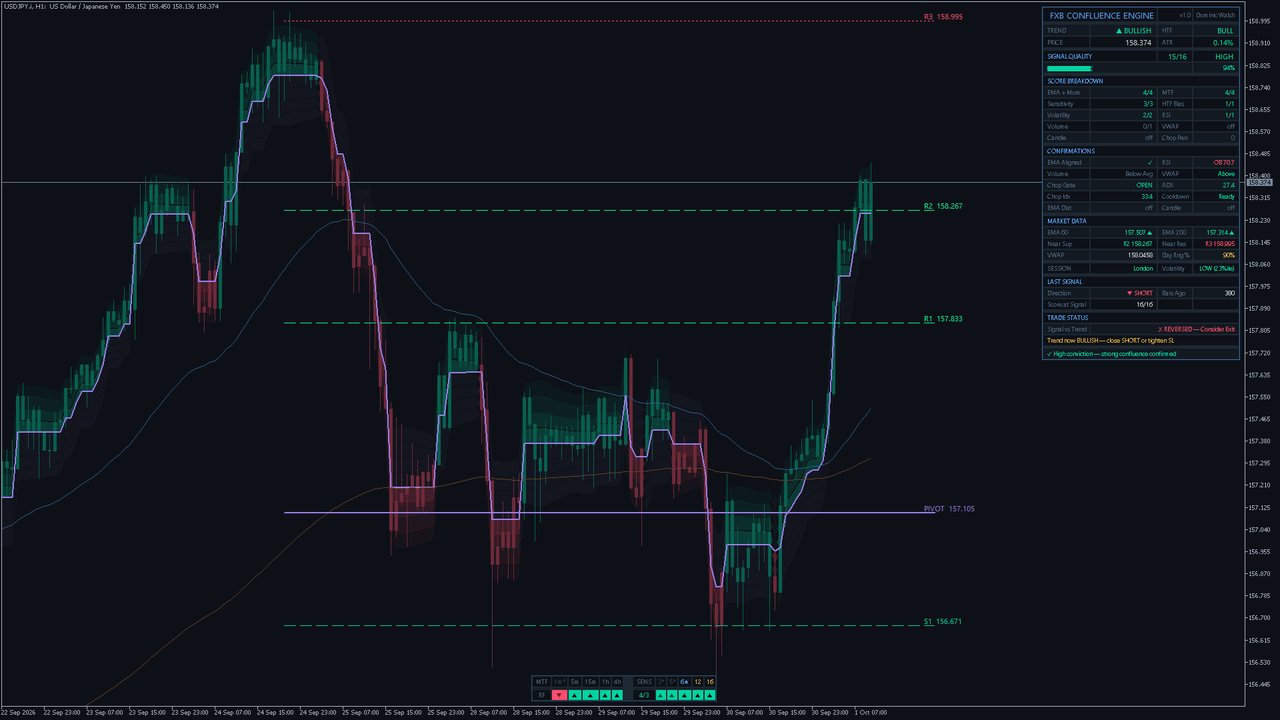
The last signal was a SHORT 380 bars ago that printed with the full 16/16. The trend has since turned bullish and scores 15/16 HIGH in that direction, so TRADE STATUS reads REVERSED, Consider Exit. A full score at the signal did not stop the trend from turning later, which is why the workflow manages every trade after entry.
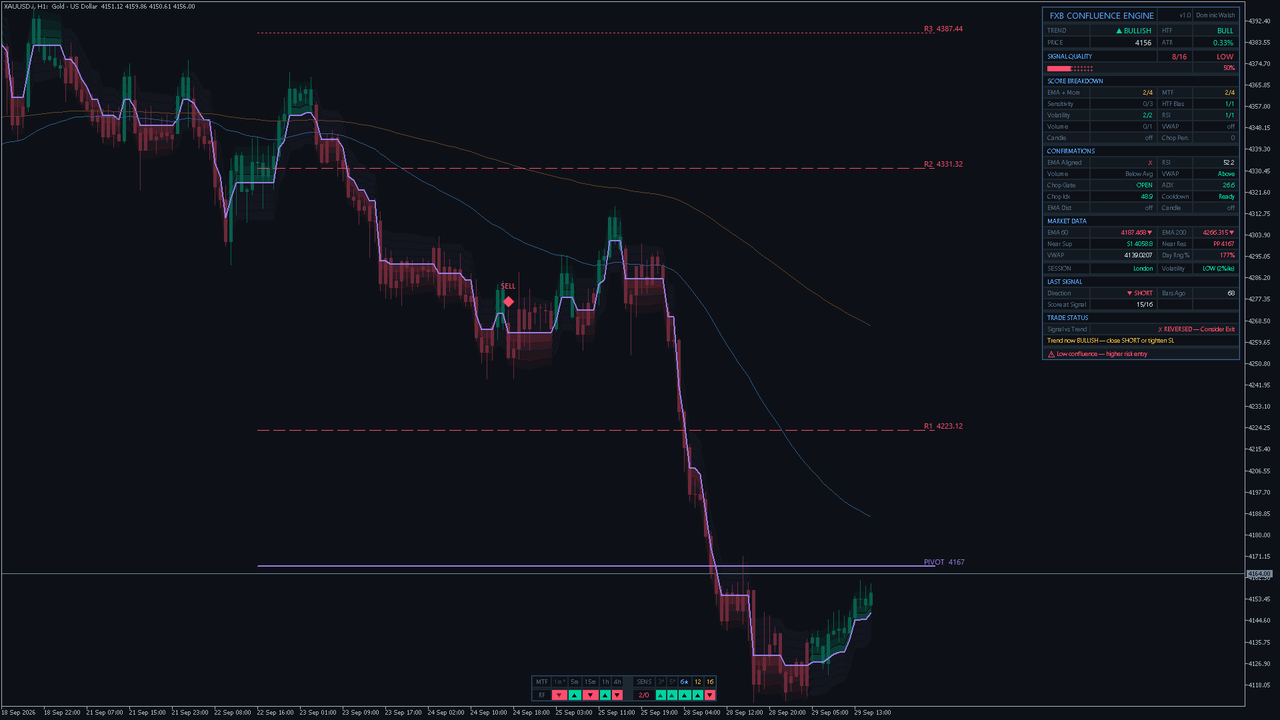
XAUUSD H1, MetaTrader 5
Gold on the hourly chart shows a bullish trend with a score now of 8/16, in the LOW band. The last signal was a SHORT 68 bars ago that printed at 15/16, and TRADE STATUS reads REVERSED, Consider Exit. The trend has turned up without printing a BUY, so that turn did not pass every gate.
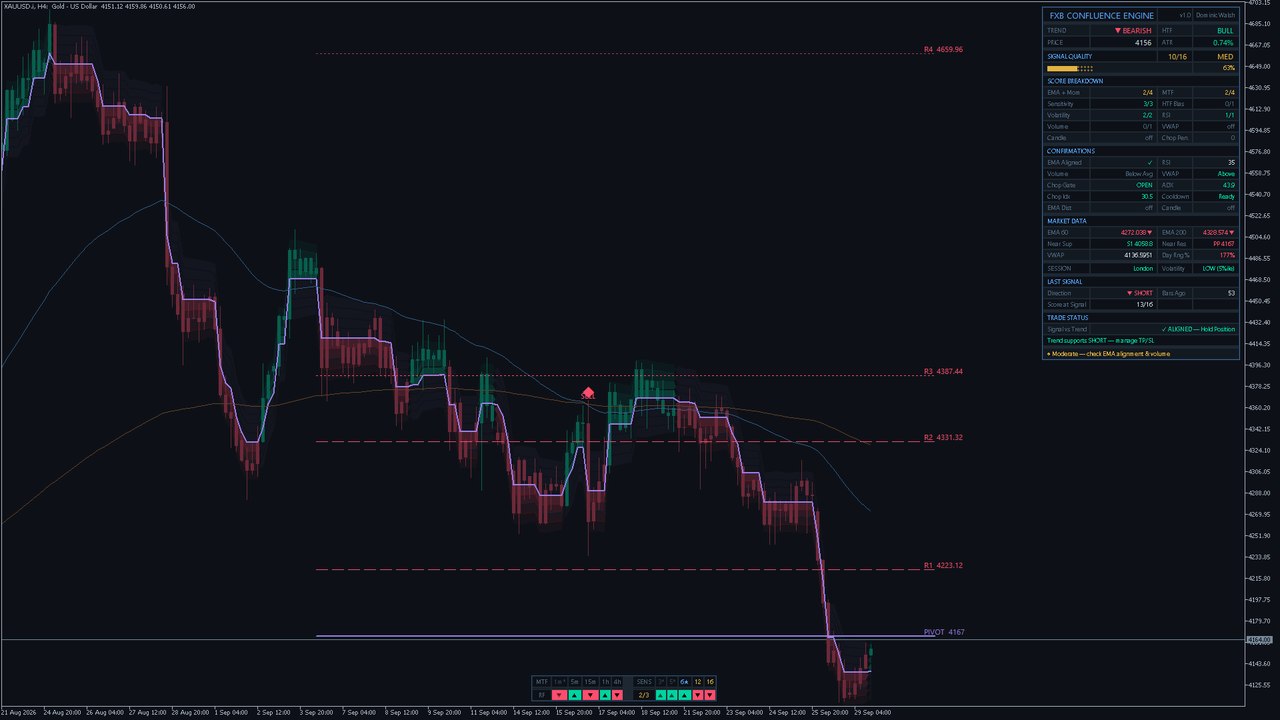
XAUUSD H4, MetaTrader 5
On the four-hour chart gold is bearish with a score now of 10/16, in the MED band. The last signal was a SHORT 53 bars ago that printed at 13/16, and TRADE STATUS reads ALIGNED, Hold Position. Set beside the H1 capture above, it shows two timeframes of the same market in different states, which is what the bottom strip summarises.
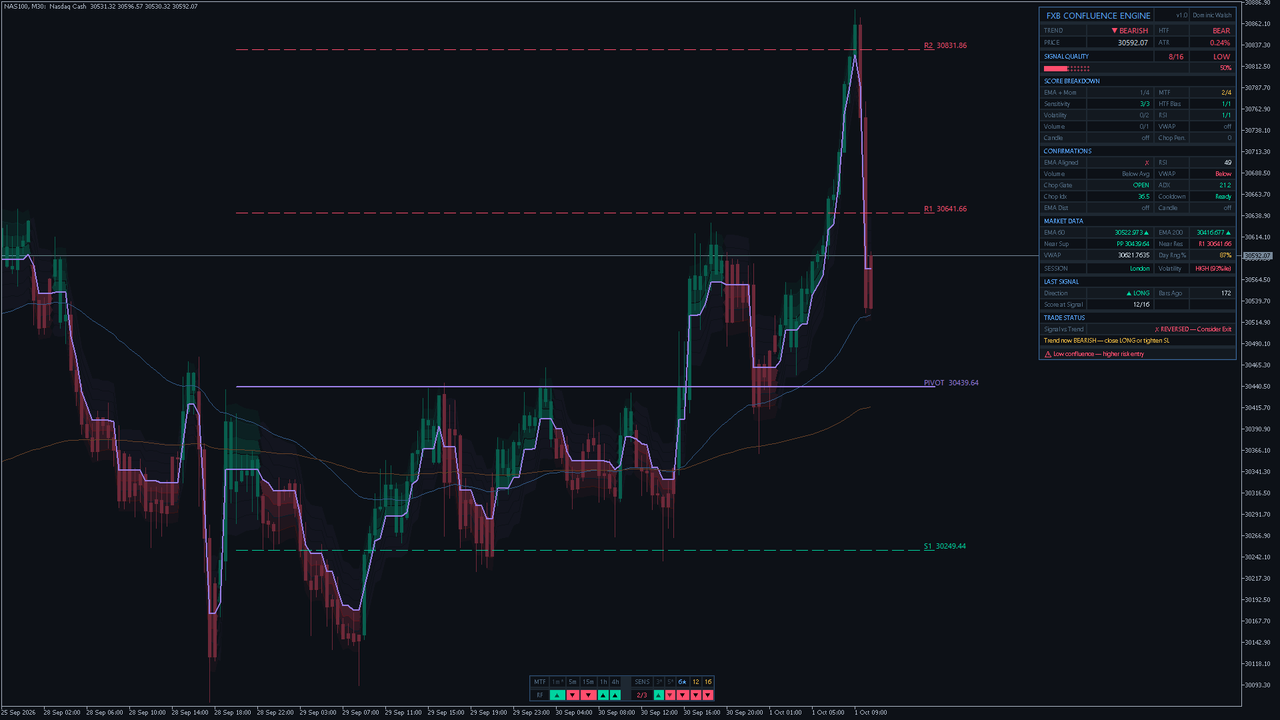
NAS100 M30, MetaTrader 5
The trend is bearish with a score now of 8/16, in the LOW band. The last signal was a LONG 172 bars ago that printed at 12/16, and TRADE STATUS reads REVERSED, Consider Exit, with the plain-words line telling a LONG holder to close or tighten the stop. This is the situation the Trade invalidated alert is designed to flag.
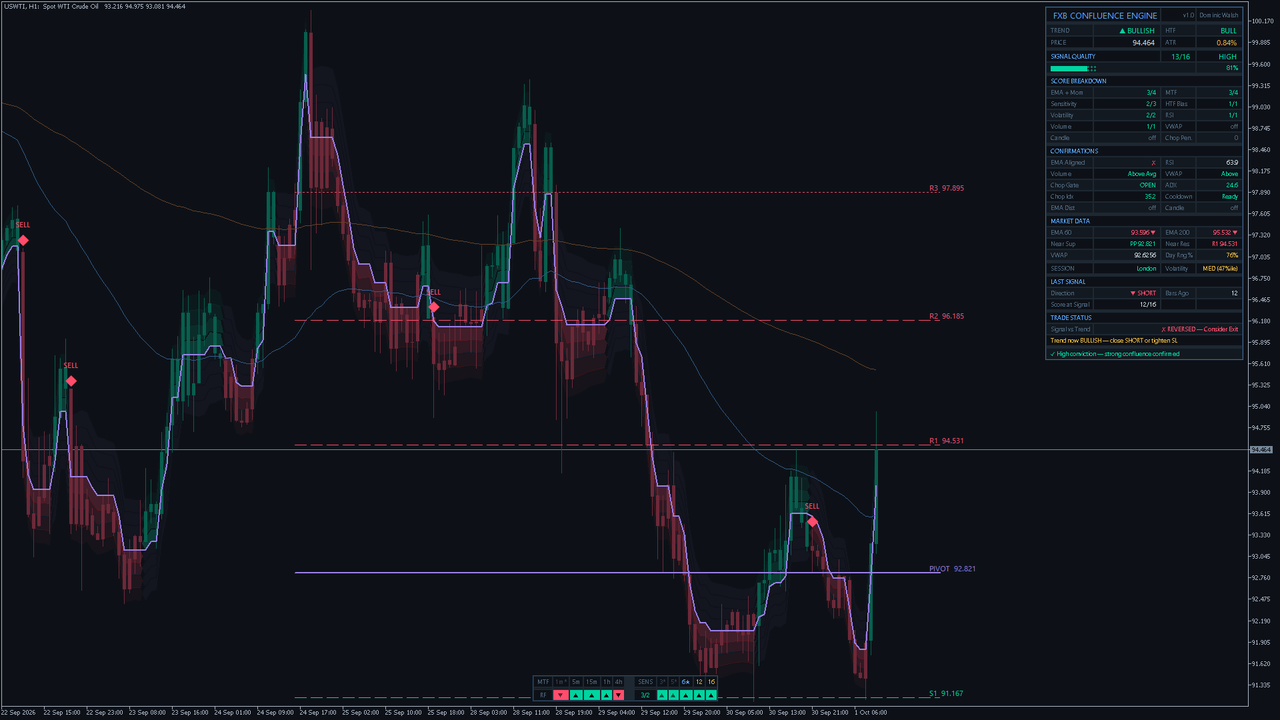
USWTI H1, MetaTrader 5
Only 12 bars after a SHORT that printed at 12/16, the trend has turned bullish and now scores 13/16 HIGH. TRADE STATUS reads REVERSED, Consider Exit. A reversal this soon after a signal is the reason the exit plan in section 13 is written before the entry, not after.
BTCUSD H1, MetaTrader 5
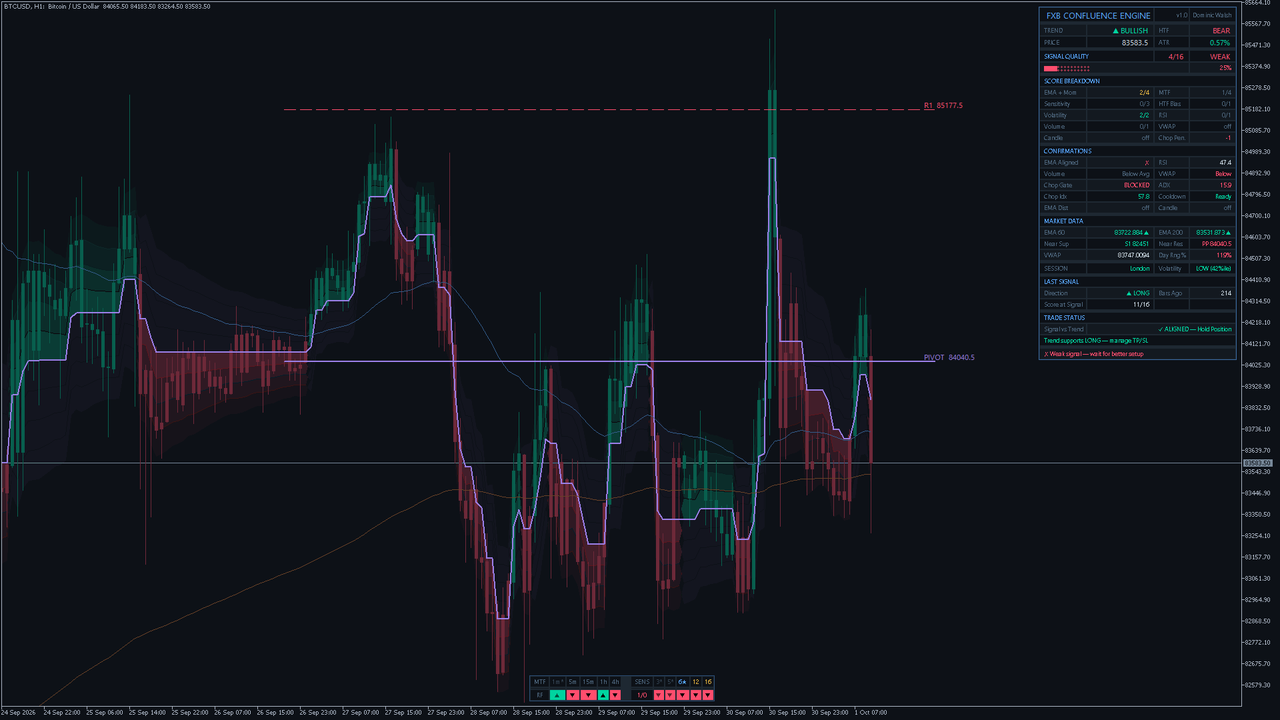
The trend is bullish, but the score now is only 4/16, in the WEAK band. The last signal was a LONG 214 bars ago that printed at 11/16, and TRADE STATUS reads ALIGNED, Hold Position. ALIGNED says the direction still matches; it says nothing about strength, which is why SIGNAL QUALITY sits on the same panel.
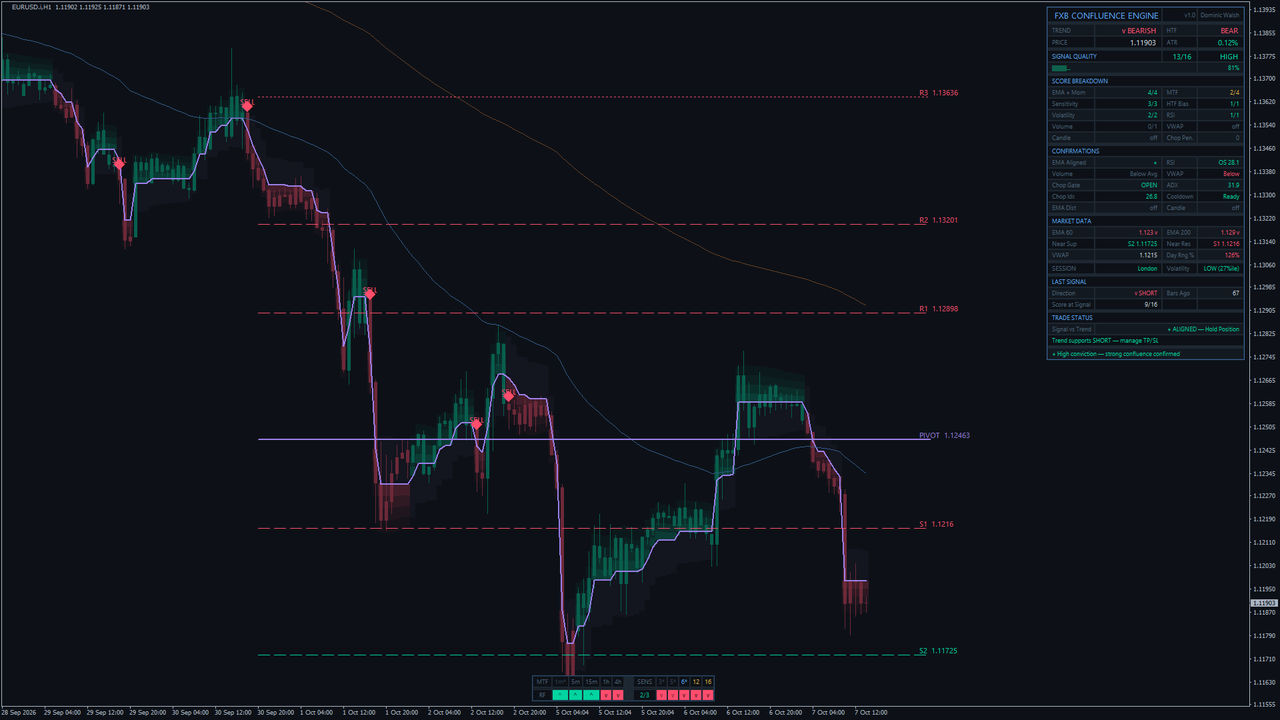
EURUSD H1, MetaTrader 4
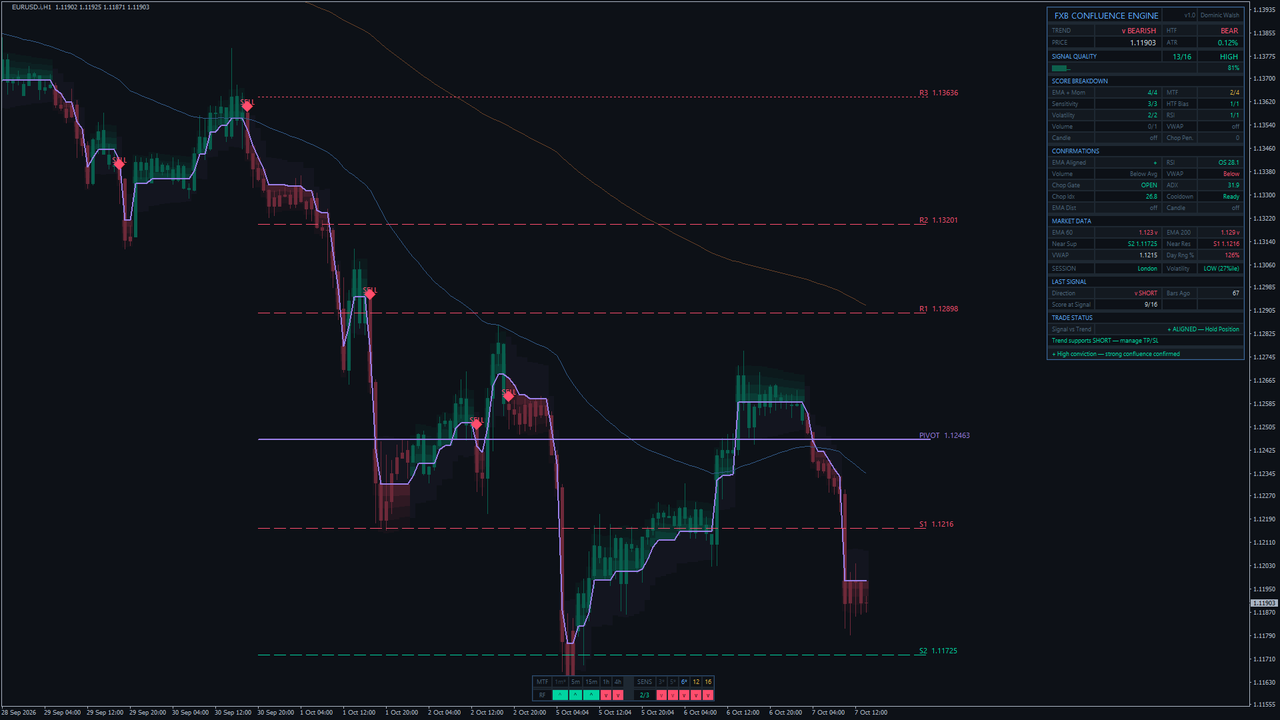
On MetaTrader 4 the trend is bearish with a score now of 13/16, in the HIGH band. The last signal was a SHORT 67 bars ago that printed at 9/16, and TRADE STATUS reads ALIGNED, Hold Position. The band and candles are drawn with histogram bars and the dashboard uses the MT4 symbols, but the reading is the same as on MetaTrader 5.
14. Installation from the MQL5 Market
Install directly from the MQL5 Market; no manual file copying is required.
- Open the product page for your platform (the links are in sections 1, 4 and 16).
- Buy the indicator on the product page. A free demo is available on the Market page if you want to try it in the Strategy Tester first; alerts stay silent there by design.
- The indicator installs automatically into your terminal through your MQL5 account.
- In MetaTrader, find it in Navigator > Indicators > Market. If it does not appear yet, restart MetaTrader or refresh the Navigator.
- Drag it onto a chart, review the inputs and click OK.
15. Parameter Reference
All 64 inputs, in dialog order and grouped as they appear in the settings.
Pivot Levels
| Input | Default | What it does |
|---|---|---|
| Show Pivot Levels | On | Pivot point, R1 to R4 and S1 to S4 of the previous period; broken lines recolour. Off also blanks Near Sup and Near Res |
| Pivot Timeframe | D1 | Previous day, week or month |
| Pivot Formula | Classic | Classic, Fibonacci or Camarilla |
| Show Pivot Labels | On | Level name and price in the symbol's own decimals |
| Extend Lines Left (bars) | 100 | Bars before the current period where the lines begin |
Core
| Input | Default | What it does |
|---|---|---|
| Sensitivity | 6 | Range filter width; higher flips less often. Scales with Sensitivity / 8 |
| ATR Length | 14 | ATR period for the filter width and the band |
| ATR Multiplier | 0.8 | Scales the filter width and the four-layer band |
Higher Timeframe
| Input | Default | What it does |
|---|---|---|
| HTF Timeframe | M30 | Feeds the HTF Bias layer (one point) and the TREND / HTF row |
| HTF MA Length | 90 | No effect in this version; kept so saved settings keep loading |
EMA Overlay
| Input | Default | What it does |
|---|---|---|
| Show EMA Lines | On | Draws the fast and slow EMAs |
| Fast EMA | 60 | Used by EMA + Momentum, EMA alignment and EMA distance |
| Slow EMA | 200 | Fast above it is bullish alignment, below it bearish |
Anti-Chop Filters
| Input | Default | What it does |
|---|---|---|
| Enable ADX Filter | On | Blocks signals while ADX is below the threshold; one point off the score |
| ADX Length | 14 | ADX period |
| ADX Threshold | 20.0 | Minimum ADX for a trend; 20 moderate, 25 strict |
| Enable Choppiness Index Filter | On | Blocks signals while the index is above the maximum; one point off the score |
| Choppiness Length | 14 | Choppiness Index period |
| Choppiness Max | 61.8 | Highest value that still counts as trending; lower is stricter |
| Enable Signal Cooldown | On | Blocks the next signal until Cooldown Bars have closed |
| Cooldown Bars | 5 | Minimum closed bars between two signals |
Signal Confirmation
| Input | Default | What it does |
|---|---|---|
| Enable RSI Confirmation | On | BUY needs RSI at or above the long minimum, SELL at or below the short maximum; one point |
| RSI Length | 14 | RSI period |
| RSI Min for Longs | 50.0 | Lowest RSI that still allows a BUY |
| RSI Max for Shorts | 50.0 | Highest RSI that still allows a SELL |
| RSI Overbought Level | 70.0 | For the RSI alert and the dashboard; does not block signals |
| RSI Oversold Level | 30.0 | For the RSI alert and the dashboard; does not block signals |
| Enable Volume Confirmation | On | Volume at or above average times the multiplier; one point. Forex volume is tick volume |
| Volume MA Length | 20 | Length of the volume average |
| Volume Threshold Multiplier | 1.0 | 1.0 means at least average |
| Enable VWAP Confirmation | Off | BUY above the daily VWAP, SELL below; one point added to score and maximum |
| Enable Candle Pattern Confirmation | Off | Engulfing or strong-body candle; one point added to score and maximum |
| Enable EMA Distance Filter | Off | Blocks signals too far from the fast EMA |
| Max EMA Distance (ATR mult) | 2.0 | Maximum distance from the fast EMA, in ATRs |
| Minimum Signal Strength | 8 | Signals scoring below this are not shown; out of 16 at the defaults |
Display
| Input | Default | What it does |
|---|---|---|
| Show LONG/SHORT Labels | Off | Score label at each signal, for example BUY 11/16 |
| Show Signal Arrows | On | Diamond and BUY or SELL text on each signal bar |
| Show Range Filter Line | On | Draws the range filter line |
| Show Trailing Band | On | Four shaded layers either side of the line |
| Show Background Tint | Off | Tints the background green or red by trend |
| Only show signals when EMA aligned | On | Requires full EMA alignment; filters the signal itself |
Dashboard
| Input | Default | What it does |
|---|---|---|
| Show Dashboard | On | Shows the main panel |
| Dashboard Position | Right | Top left or top right corner |
| Dashboard Text Size | Small | Tiny, Small or Normal |
| Show Bottom Strip (MTF + Sensitivity) | On | Five timeframes and five sensitivities |
Theme
| Input | Default | What it does |
|---|---|---|
| Chart Background | Dark | Dark or Light palette; changes no calculated value |
MetaTrader
| Input | Default | What it does |
|---|---|---|
| Paint Bars | On | Candles by trend: teal up, red down |
| Bars to calculate (0 = all) | 5000 | Recent bars calculated; 0 means all history |
| Server time zone (session row) | Auto | Session row only; Auto reads your broker's clock |
Alerts
| Input | Default | What it does |
|---|---|---|
| Enable alerts | On | Master switch; closed bars only |
| Alert: BUY and SELL signals | On | Signal with price, score, HTF bias, RSI and volume |
| Alert: Strong signals (score 80%+) | Off | Score at least 80 percent of the maximum |
| Alert: EMA-confirmed signals | Off | Signal with full EMA alignment |
| Alert: Trend change | Off | Confirmed trend turning |
| Alert: Chop gate opened / closed | Off | Anti-chop gate opening or closing |
| Alert: HTF bias change | Off | Higher-timeframe bias turning |
| Alert: RSI enters overbought / oversold | Off | Once on entry into the zone |
| Alert: Volume spike | Off | Volume at twice its average |
| Alert: Score crosses the minimum | Off | Score crossing Minimum Signal Strength, up or down |
| Alert: Trade invalidated | On | Trend reversing against the last signal |
| Channel: popup window | On | MetaTrader's alert window, with its own sound |
| Channel: sound | On | Plays alert.wav, only when the popup is off |
| Channel: push notification | Off | To the MetaTrader app on your phone |
| Channel: e-mail | Off | Through the terminal's mail settings |
16. Conclusion
Confluence is simple to describe and hard to apply by hand: count the independent evidence behind a trend change, refuse the change when the market is moving sideways, and keep checking after the entry. FXB Confluence Engine turns that into a routine. A range filter supplies the candidates, a ten-layer confluence score weighs each one out of 16 at the defaults, the chop filter and the confirmation gates refuse what does not qualify, and the multi-timeframe dashboard shows every part of the decision. Signals, the score, the filters and the alerts are fixed on closed bars; the line, the band, the candle colour and the dashboard move with the forming bar.
What the indicator leaves to you is the exit: the filter line, the band or the signal bar for the stop, the nearest pivot for the first target, and TRADE STATUS with the Trade invalidated alert for everything after. If you want a confluence indicator for MT4 and MT5 that shows its reasoning instead of only an arrow, the product pages have the full details:
- MetaTrader 5: FXB Confluence Engine MT5
- MetaTrader 4: FXB Confluence Engine MT4
Questions about the settings or the workflow are welcome in the comments below.
Risk Disclaimer
Trading foreign exchange, CFDs, indices, commodities and cryptocurrencies on margin carries a high level of risk and may not be suitable for every investor. You can lose some or all of the money you trade with. FXB Confluence Engine is an analysis tool: it does not trade, it does not place stops or targets, and no signal, score or alert is a recommendation to buy or sell. Past chart behaviour does not indicate future results. Test any approach on a demo account first and trade only with money you can afford to lose.




