VWAP Profile

MQL5 Blogs = https://www.mql5.com/en/blogs/post/776258
MT4 Version = https://www.mql5.com/en/market/product/197233
MT5 Version = https://www.mql5.com/en/market/product/197234
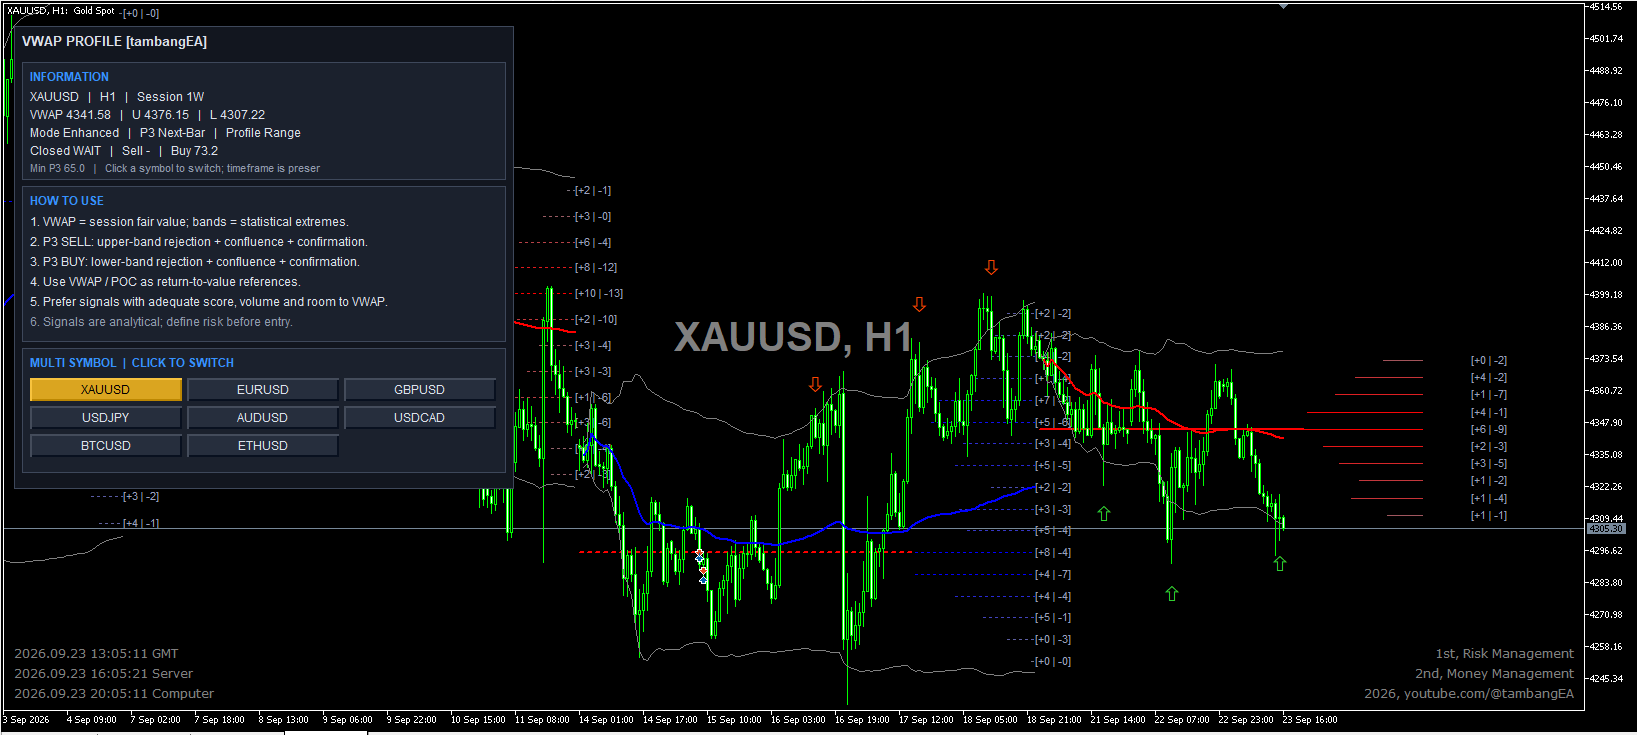
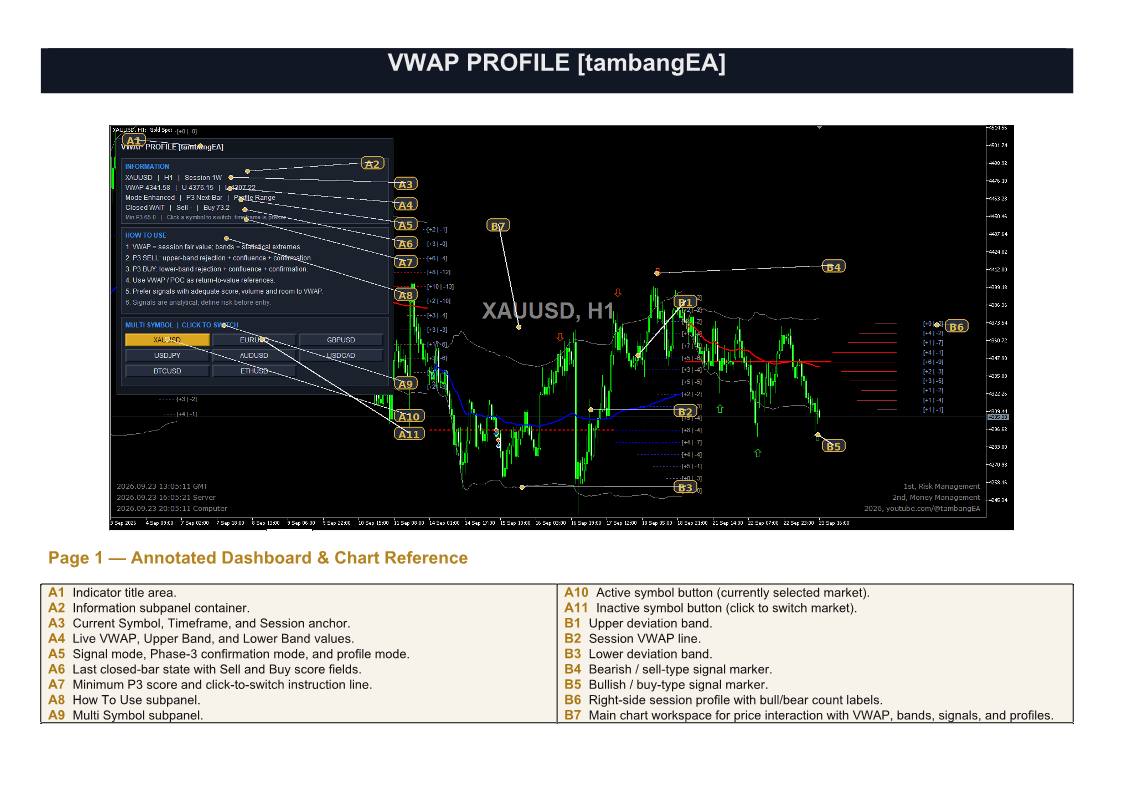
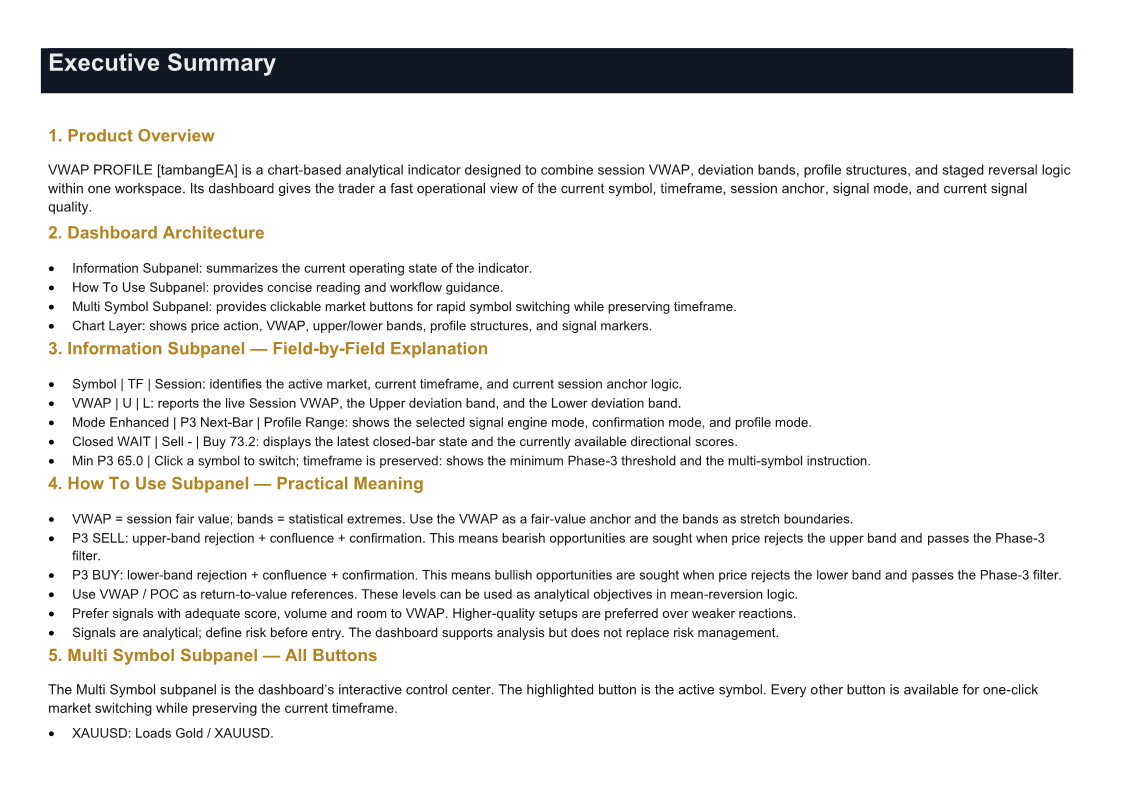
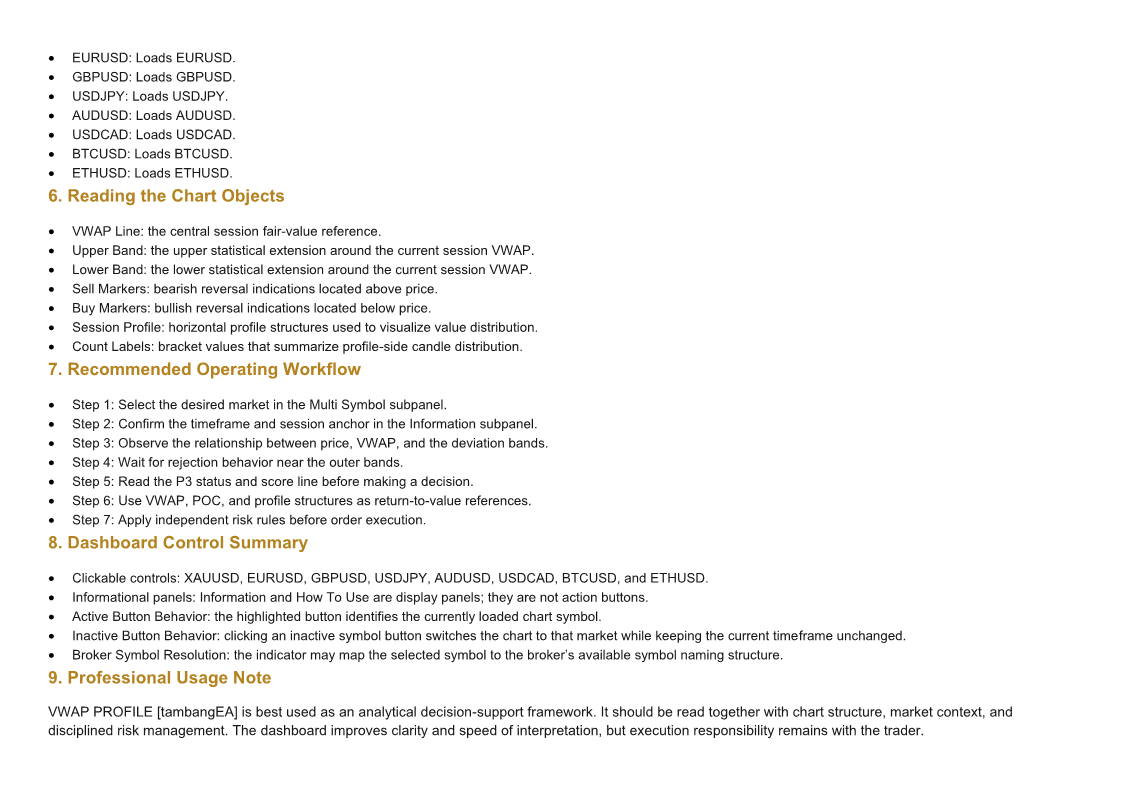
VWAP PROFILE [tambangEA] is an advanced session-based VWAP and market profile indicator designed to help traders identify fair value, statistical price extremes, potential mean-reversion opportunities, and important value areas directly on the chart.
The indicator combines Session VWAP, deviation bands, price profile analysis, Point of Control (POC), rejection signals, confirmation logic, and an interactive multi-symbol dashboard in one integrated trading workspace.
It is designed for traders who want a structured way to evaluate whether price is trading near fair value, becoming statistically extended, or showing a potential rejection from an extreme area.
Core Features
Session VWAP
The central VWAP represents the volume-weighted fair value of the active session.
The indicator continuously calculates:
VWAP = Sum(Price × Volume) / Sum(Volume)
This provides a dynamic reference for evaluating whether price is trading above, below, or close to the session's weighted equilibrium.
Statistical Deviation Bands
VWAP PROFILE [tambangEA] calculates upper and lower statistical bands around the session VWAP.
These bands can help identify:
- Overextended price conditions
- Potential rejection areas
- Mean-reversion zones
- Volatility expansion
- Session extremes
The upper and lower bands dynamically adapt as the session develops.
VWAP Profile
The indicator creates a visual price profile inside the VWAP distribution area.
The profile helps identify where market activity has concentrated during the active session.
Higher-density areas may represent zones where price has spent more time or accumulated more activity.
The profile can therefore be used to identify potential:
- Value areas
- Reaction zones
- Support and resistance
- Mean-reversion targets
- Liquidity concentration areas
Point of Control — POC
The Point of Control represents the price area with the highest profile activity.
POC can be used as an important reference for:
- Return-to-value analysis
- Intraday equilibrium
- Profit targets
- Support/resistance evaluation
- Market acceptance
When price becomes extended away from VWAP or POC, traders can monitor whether the market begins rotating back toward value.
Bull / Bear Profile Information
Each profile level can display bullish and bearish candle counts.
Example:
[+8 | -12]
This means that the corresponding profile area contains:
- 8 bullish candles
- 12 bearish candles
This information is designed to provide additional context about candle behavior within each price zone.
Please note that these values represent bullish and bearish candle counts, not true Bid/Ask order-flow delta.
Multi-Stage Signal Engine
VWAP PROFILE [tambangEA] includes several layers of signal processing.
Original Rejection Logic
A potential bearish rejection may occur when:
- Price trades above the Upper VWAP Band
- The candle closes back below the band
A potential bullish rejection may occur when:
- Price trades below the Lower VWAP Band
- The candle closes back above the band
This identifies situations where price temporarily moves outside the statistical boundary but fails to remain there.
Enhanced Signal Processing
The enhanced engine evaluates additional conditions to reduce weak rejection signals.
The analysis may include:
- Band excursion strength
- Close-back depth
- Wick quality
- Candle direction
- Session maturity
- Band width
- VWAP distance
- POC context
- Trend strength
- VWAP slope
This provides a more selective signal framework than a simple band touch.
Phase 3 Confluence Engine
The Phase 3 engine adds another confirmation layer.
A confluence score can evaluate multiple factors, including:
- Rejection quality
- Relative volume
- Candle close location
- Market regime
- Distance and reward potential toward VWAP
Signals must reach the configured minimum score before they qualify for further confirmation.
This allows the indicator to focus on higher-quality setups rather than generating signals from every band interaction.
Next-Bar Confirmation
The Phase 3 engine can require the next completed candle to confirm the rejection.
For example, a bearish setup may require:
- Price rejection from the Upper Band
- Sufficient confluence score
- Bearish confirmation from the following candle
- No structural invalidation of the original rejection
The same logic is applied inversely for bullish setups.
This additional confirmation can help filter temporary or weak band reactions.
Interactive Dashboard
VWAP PROFILE [tambangEA] includes a professional on-chart dashboard.
Information Panel
The Information section displays important real-time information, including:
- Current Symbol
- Current Timeframe
- Session Anchor
- VWAP
- Upper Band
- Lower Band
- Signal Mode
- Phase 3 Mode
- Profile Mode
- Latest closed-bar status
- Sell Score
- Buy Score
- Minimum Phase 3 Score
This allows traders to monitor the indicator without opening additional windows.
How To Use Panel
A built-in How To Use section provides quick operating guidance directly on the chart.
The dashboard explains the basic interpretation of:
- Session VWAP
- Statistical deviation bands
- P3 SELL conditions
- P3 BUY conditions
- VWAP / POC return-to-value analysis
- Signal quality considerations
Multi-Symbol Dashboard
The indicator includes a Click-to-Switch Multi Symbol panel.
Available symbols can include:
- XAUUSD
- EURUSD
- GBPUSD
- USDJPY
- AUDUSD
- USDCAD
- BTCUSD
- ETHUSD
Simply click a symbol button to change the current chart.
The current timeframe is preserved during the switch.
For example:
XAUUSD H1 → click EURUSD → EURUSD H1
The active symbol is highlighted for easy identification.
The indicator can also attempt to resolve common broker symbol prefixes and suffixes.
Examples:
- XAUUSD
- XAUUSDm
- XAUUSD.a
- XAUUSD.pro
- mXAUUSD
- GOLD
Availability depends on the symbols provided by the broker.
Dynamic Session Engine
The indicator can automatically select a higher-timeframe session anchor according to the current chart timeframe.
This allows the VWAP and profile structure to adapt to different trading environments.
The session system can be used for:
- Scalping
- Intraday trading
- Swing analysis
- Session-based mean reversion
- Multi-timeframe market analysis
Manual session configuration is also available.
Dynamic Profile Resolution
Profile resolution can automatically adjust according to volatility.
During higher-volatility conditions, the profile can use more detailed price divisions.
During lower-volatility conditions, the profile can use fewer divisions.
This helps maintain a practical balance between profile detail and chart performance.
TURBO Multi-Symbol Performance
The indicator includes performance optimization designed for faster symbol switching and smoother dashboard operation.
The optimized engine reduces unnecessary calculations and graphical refreshes while preserving the main analytical components.
Features include:
- Optimized historical calculations
- Controlled profile refresh frequency
- Efficient chart-object management
- Faster symbol switching
- Reduced unnecessary dashboard refreshes
Typical Analytical Workflow
A practical workflow can be:
1. Identify the Session VWAP
Use VWAP as the main fair-value reference.
2. Observe the Deviation Bands
Monitor price when it approaches or moves outside the Upper or Lower Band.
3. Look for Rejection
Wait for price to reject the statistical extreme.
4. Check Signal Quality
Review the Phase 3 score and confirmation state.
5. Evaluate VWAP and POC
Use VWAP and POC as potential return-to-value references.
6. Confirm Market Context
Consider trend strength, volatility, price structure, and available room toward value.
7. Apply Risk Management
Define the invalidation level and risk before entering a position.
Suitable Markets
VWAP PROFILE [tambangEA] can be used on many instruments, including:
- Gold / XAUUSD
- Forex
- Major currency pairs
- Indices
- Cryptocurrency
- CFDs
Actual results and volume characteristics depend on the broker and the available market data.
Important Notes
VWAP PROFILE [tambangEA] is an analytical and decision-support indicator.
It does not guarantee future price movement or profitable trading results.
Signal quality may vary depending on:
- Symbol
- Timeframe
- Broker data
- Spread
- Volatility
- Market session
- Market regime
For decentralized Forex and CFD markets, volume may represent broker-provided tick volume rather than centralized exchange volume.
Users should always apply appropriate position sizing, stop-loss management, and independent trading judgment.