MSX AI Multi Symbol Scalper v2.10 — XAUUSD M1 Strategy Tester Report | August 2026

Detailed Symbol-Level Strategy Tester Analysis
Following the BTCUSD report, this is the second report in the MSX AI Multi Symbol Scalper 12-Symbol Strategy Tester Analysis Series.
This report focuses specifically on XAUUSD (Gold) and documents the Strategy Tester configuration, trading parameters, risk controls, session settings and historical test statistics for the period 01 August 2026 to 31 August 2026.
The purpose is to provide a transparent, reproducible reference for traders who want to study the EA's historical behaviour on an individual asset before conducting their own Demo/forward evaluation.
For the complete 12-Symbol Strategy Tester Analysis Series and other available symbol reports, visit:
12-Symbol Strategy Tester Analysis Series
1. Test Objective
MSX AI Multi Symbol Scalper is designed for multi-symbol portfolio deployment. In a complete deployment, each enabled symbol can operate through independent BUY ONLY and SELL ONLY Engines.
However, MetaTrader 5 Strategy Tester operates as a single-symbol simulation environment.
Therefore, this XAUUSD test should be understood as an individual-symbol reference test, not as a representation of the complete multi-symbol portfolio.
For this study, both BUY and SELL trading directions were enabled so that the XAUUSD symbol could be evaluated in both market directions within the isolated Strategy Tester environment.
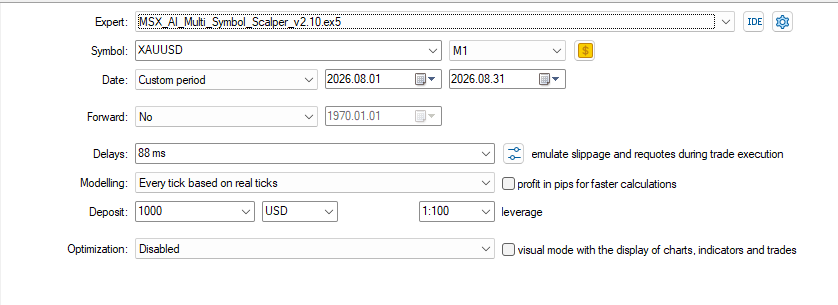
2. Strategy Tester Configuration
The XAUUSD test was performed using:
| Parameter | Configuration |
|---|---|
| Expert Advisor | MSX AI Multi Symbol Scalper v2.10 |
| Symbol | XAUUSD |
| Timeframe | M1 |
| Test Period | 01 Aug 2026 – 31 Aug 2026 |
| Forward Testing | No |
| Modeling | Every tick based on real ticks |
| Execution Delay | 88 ms |
| Initial Deposit | USD 1,000 |
| Leverage | 1:100 |
| Optimization | Disabled |
| Symbols Tested | 1 |
The use of Every tick based on real ticks provides a tick-level historical simulation using the available real-tick data for this test.
The configured 88 ms execution delay was also enabled to emulate execution effects such as slippage and requotes during the test.
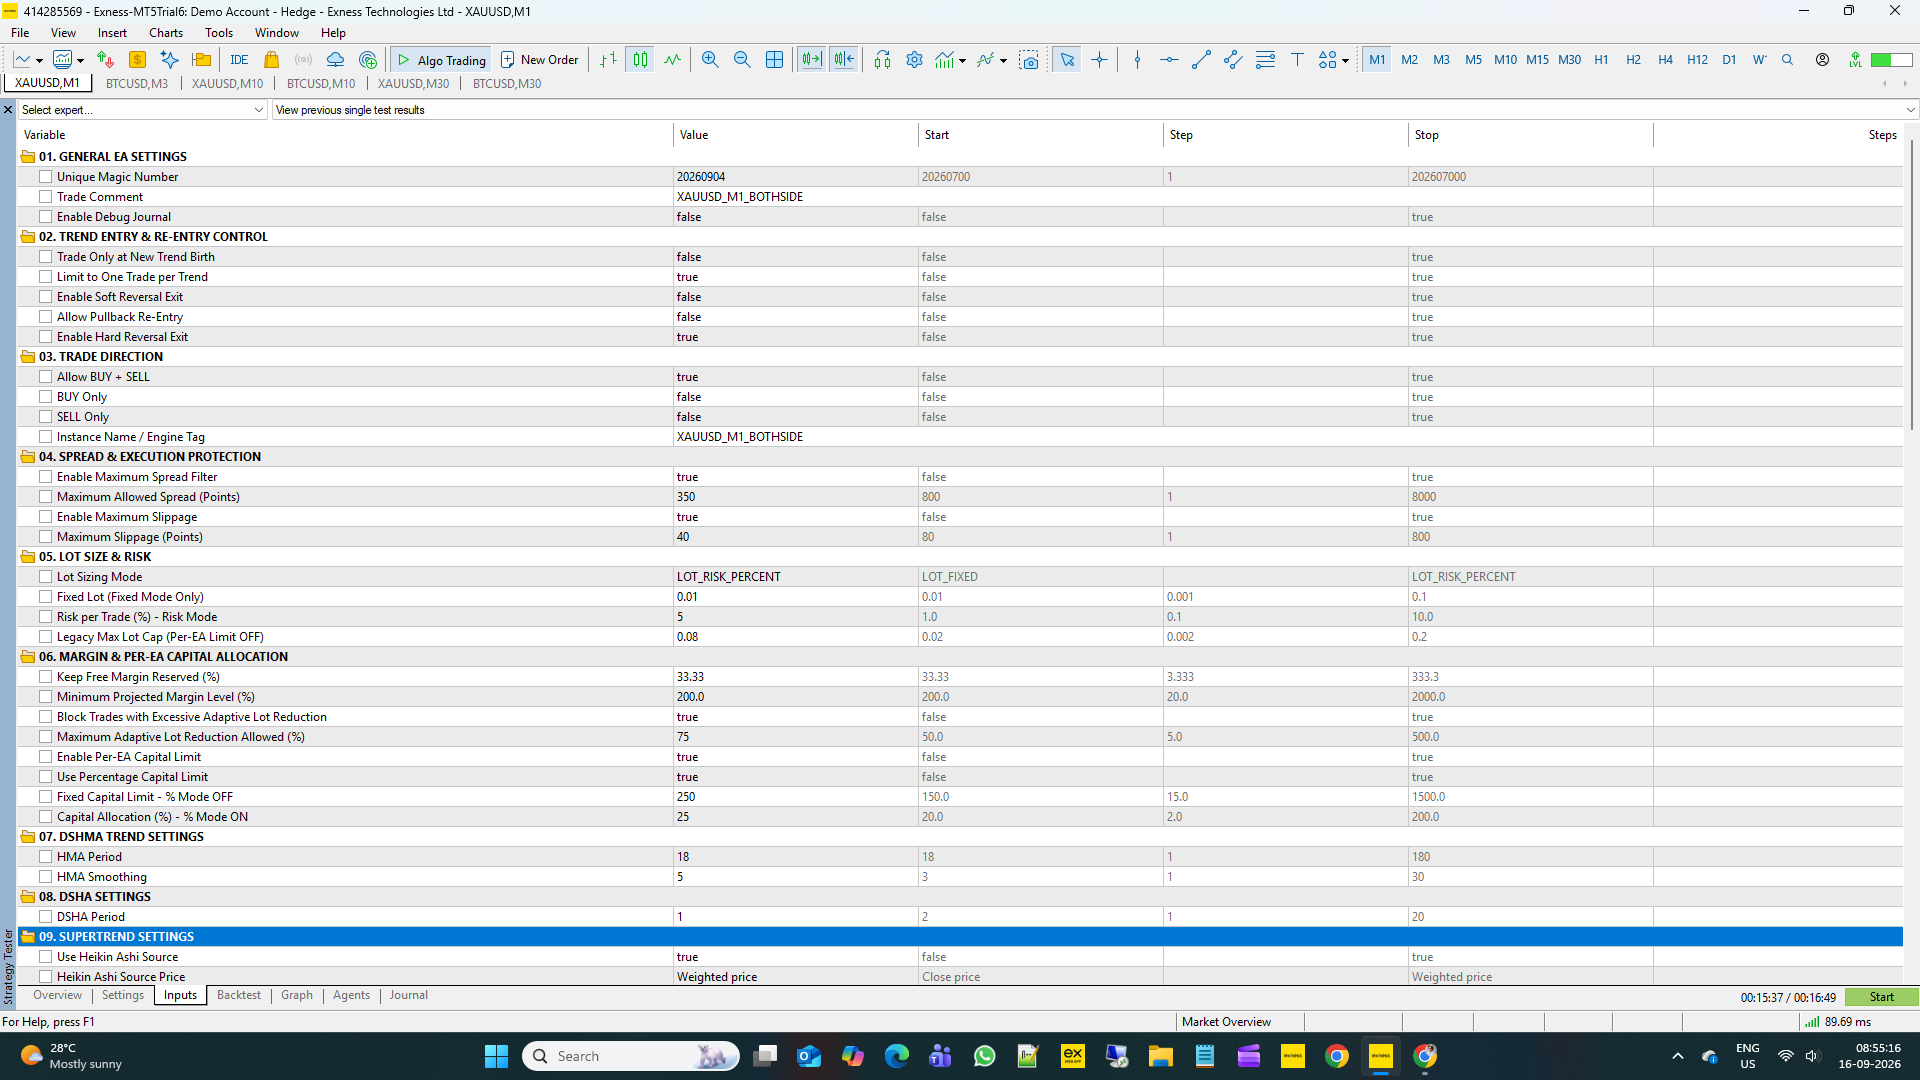
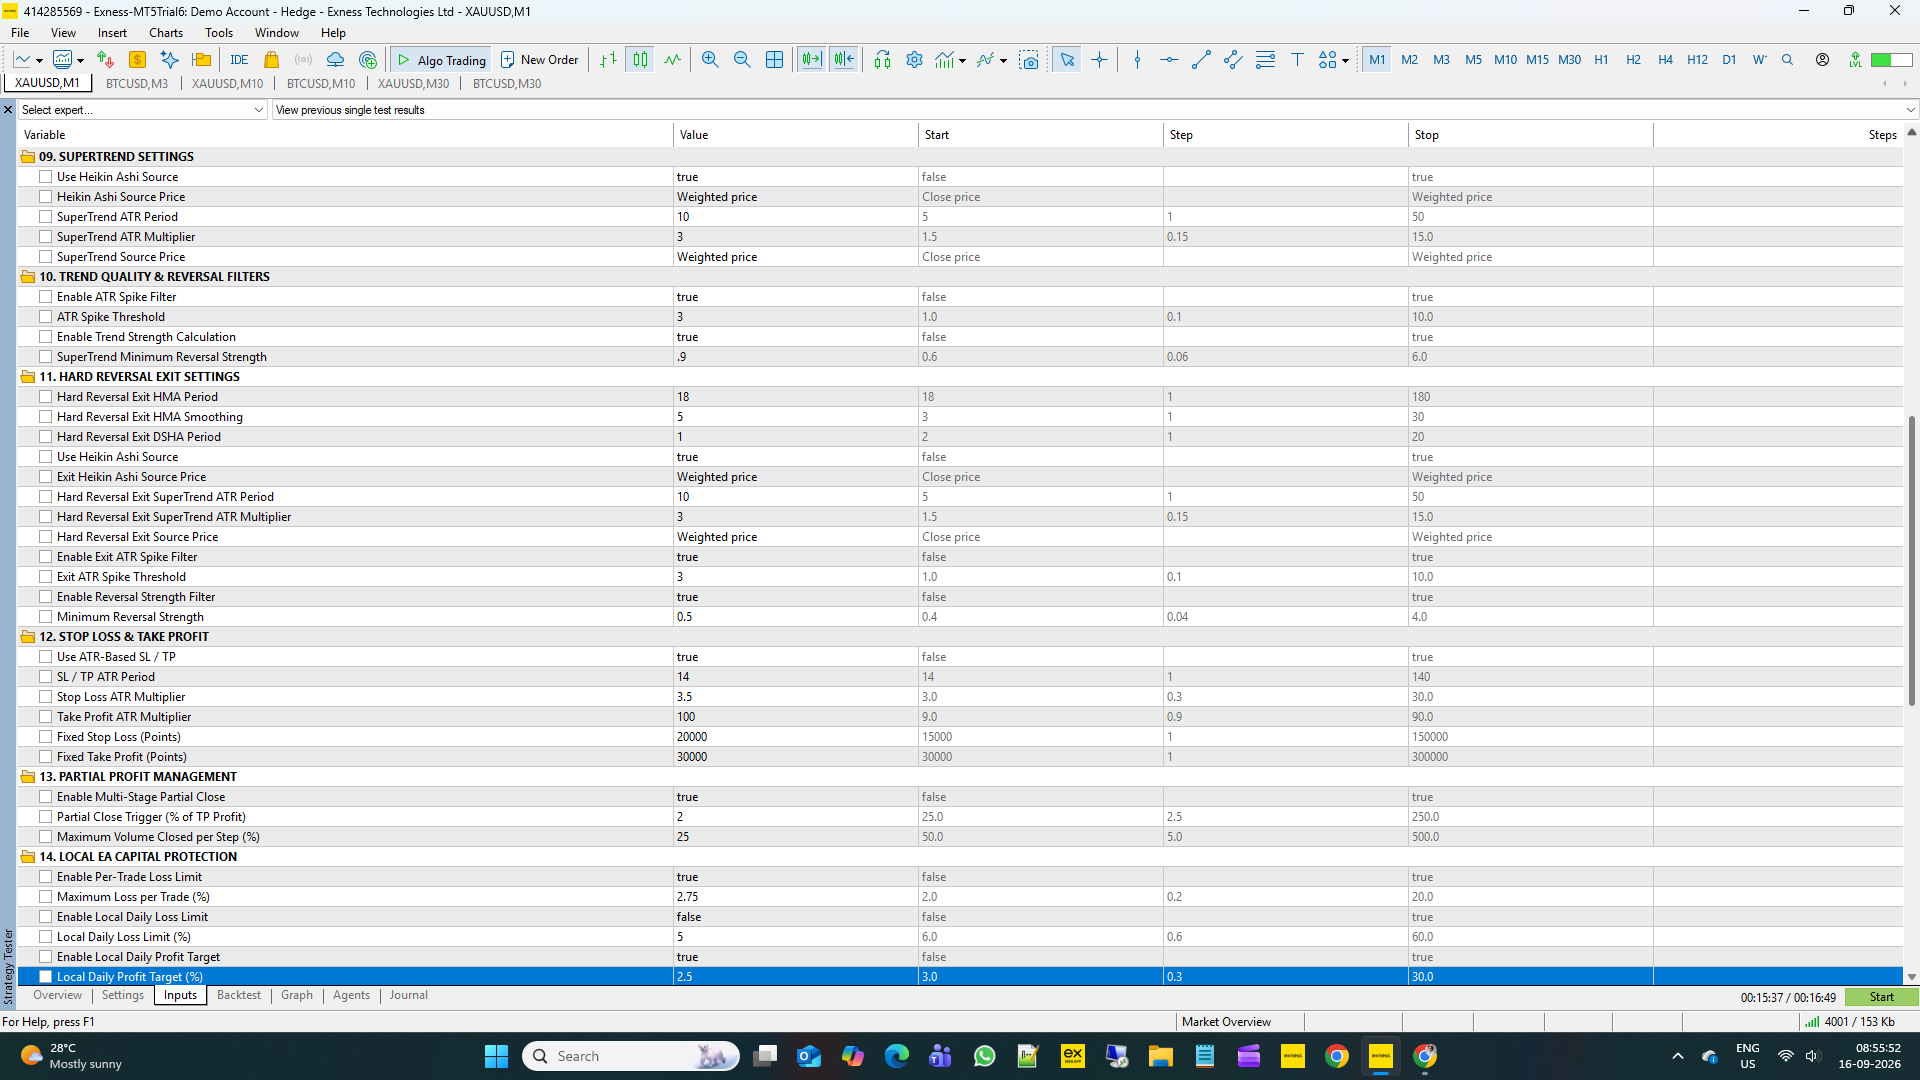
3. XAUUSD Trading Configuration
The tested XAUUSD configuration used:
Trade Direction
• BUY + SELL — Enabled
• BUY Only — Disabled
• SELL Only — Disabled
This means the isolated XAUUSD test allowed the EA to participate in both directions.
Trend Entry & Re-Entry
• Trade Only at New Trend Birth — Disabled
• Limit to One Trade per Trend — Enabled
• Soft Reversal Exit — Disabled
• Pullback Re-Entry — Disabled
• Hard Reversal Exit — Enabled
The configuration therefore used the Hard Reversal Exit while keeping Soft Reversal Exit and Pullback Re-Entry disabled for this particular test.
4. Spread & Execution Protection
The test configuration included:
• Maximum Spread Filter — Enabled
• Maximum Allowed Spread — 350 points
• Maximum Slippage — Enabled
• Maximum Slippage — 40 points
These settings form part of the execution-protection configuration used for this XAUUSD study.
5. Risk & Capital Allocation
The XAUUSD test used:
• Lot Sizing Mode — LOT_RISK_PERCENT
• Risk per Trade — 5%
• Legacy Max Lot Cap — 0.08
• Free Margin Reserve — 33.33%
• Minimum Projected Margin Level — 200%
• Excessive Adaptive Lot Reduction Block — Enabled
• Maximum Adaptive Lot Reduction Allowed — 75%
• Per-EA Capital Limit — Enabled
• Percentage Capital Limit — Enabled
• Capital Allocation — 25%
This configuration combines percentage-based risk sizing with free-margin reservation, projected margin protection and per-EA capital allocation.
6. Trend Engine Configuration
The XAUUSD M1 test used:
DSHMA Trend
• HMA Period — 18
• HMA Smoothing — 5
DSHA
• DSHA Period — 1
SuperTrend
• Heikin Ashi Source — Enabled
• Heikin Ashi Source Price — Weighted Price
• ATR Period — 10
• ATR Multiplier — 3.0
• Source Price — Weighted Price
Trend Quality Filters
• ATR Spike Filter — Enabled
• ATR Spike Threshold — 3.0
• Trend Strength Calculation — Enabled
• Minimum SuperTrend Reversal Strength — 0.9
7. Hard Reversal Exit Configuration
The dedicated Hard Reversal Exit configuration used the following parameters:
• Exit HMA Period — 18
• Exit HMA Smoothing — 5
• Exit DSHA Period — 1
• Heikin Ashi Source — Enabled
• Exit Heikin Ashi Source Price — Weighted Price
• Exit SuperTrend ATR Period — 10
• Exit SuperTrend ATR Multiplier — 3.0
• Exit Source Price — Weighted Price
• Exit ATR Spike Filter — Enabled
• Exit ATR Spike Threshold — 3.0
• Exit Reversal Strength Filter — Enabled
• Minimum Reversal Strength — 0.5
The Entry and Hard Reversal Exit configurations therefore use dedicated settings rather than relying on one common indicator configuration.
8. Stop Loss & Take Profit
The test used ATR-based position protection:
• ATR-Based SL/TP — Enabled
• SL/TP ATR Period — 14
• Stop Loss ATR Multiplier — 3.5
• Take Profit ATR Multiplier — 100
The fixed SL/TP values were also present in the EA configuration but were not the active SL/TP mode because ATR-Based SL/TP was enabled.
9. Partial Profit Management
The XAUUSD configuration enabled:
• Multi-Stage Partial Close — Enabled
• Partial Close Trigger — 2% of TP Profit
• Maximum Volume Closed per Step — 25%
This means the test included the EA's multi-stage partial-profit management framework.
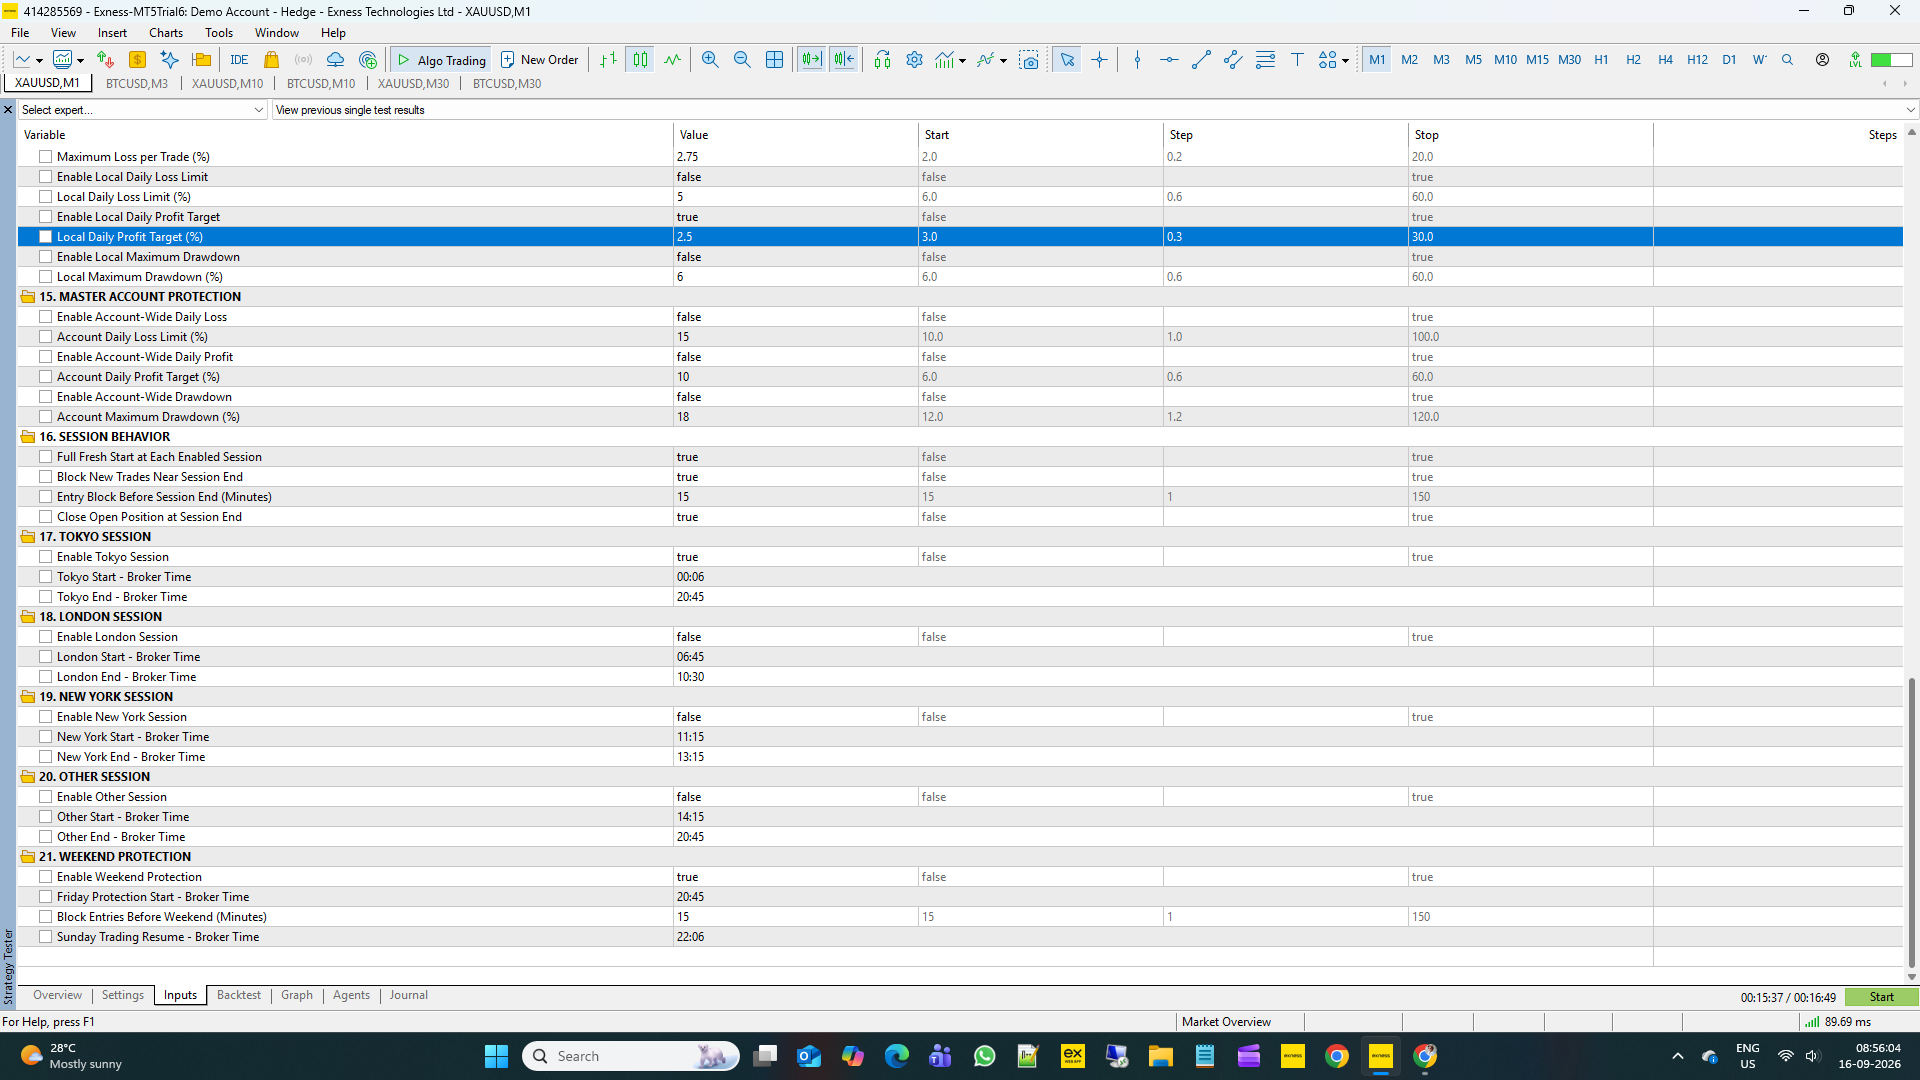
10. Local Capital Protection
The tested local protection configuration included:
• Pre-Trade Loss Limit — Enabled
• Maximum Loss per Trade — 2.75%
• Local Daily Loss Limit — Disabled
• Local Daily Profit Target — Enabled
• Local Daily Profit Target — 2.5%
• Local Maximum Drawdown — Disabled
This is important when interpreting the test because the XAUUSD run was not simply using unrestricted position sizing; several capital and execution controls were active.
11. Master Account Protection
For this isolated Strategy Tester run:
• Account-Wide Daily Loss — Disabled
• Account-Wide Daily Profit — Disabled
• Account Maximum Drawdown — Disabled
This is consistent with the distinction between the individual symbol test and the complete portfolio environment.
12. Session Configuration
The tested session configuration was:
Tokyo Session
• Enabled
• Start — 00:06 broker time
• End — 20:45 broker time
London Session
• Disabled
New York Session
• Disabled
Other Session
• Disabled
Session Behaviour
• Full Fresh Start at Each Enabled Session — Enabled
• Block New Trades Near Session End — Enabled
• Entry Block Before Session End — 15 minutes
• Close Open Position at Session End — Enabled
Weekend Protection
• Enabled
• Friday Protection Start — 20:45 broker time
• Block Entries Before Weekend — 15 minutes
• Sunday Trading Resume — 22:06 broker time
All times shown here are broker-server times from the tested configuration.
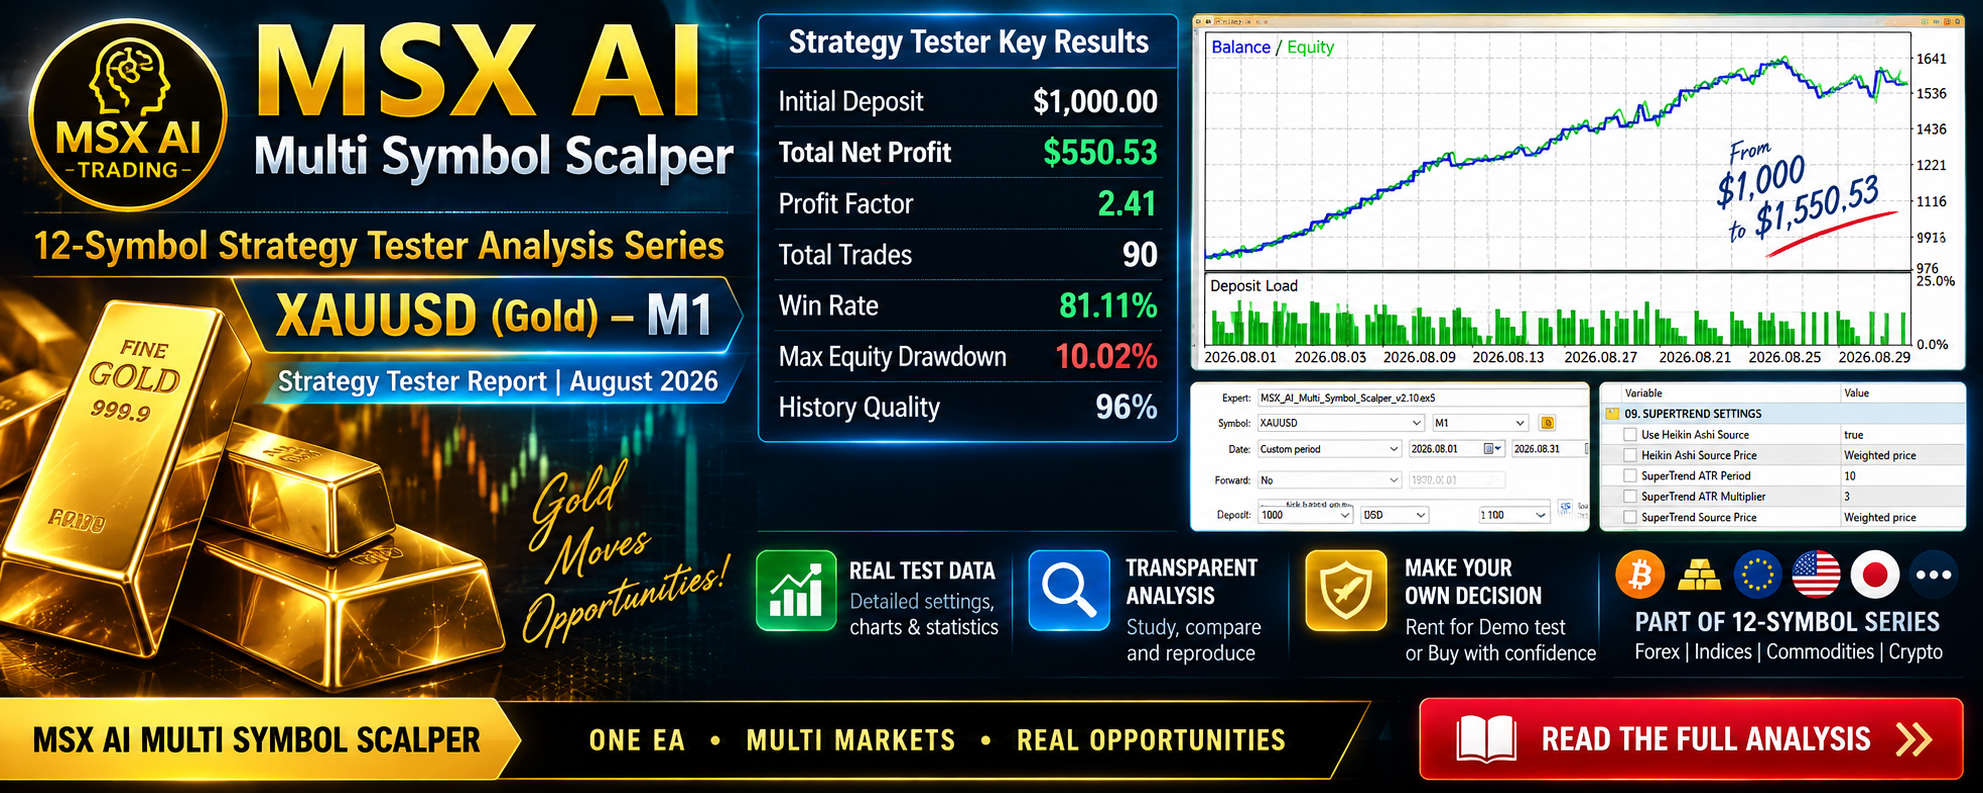
13. Historical Strategy Tester Results
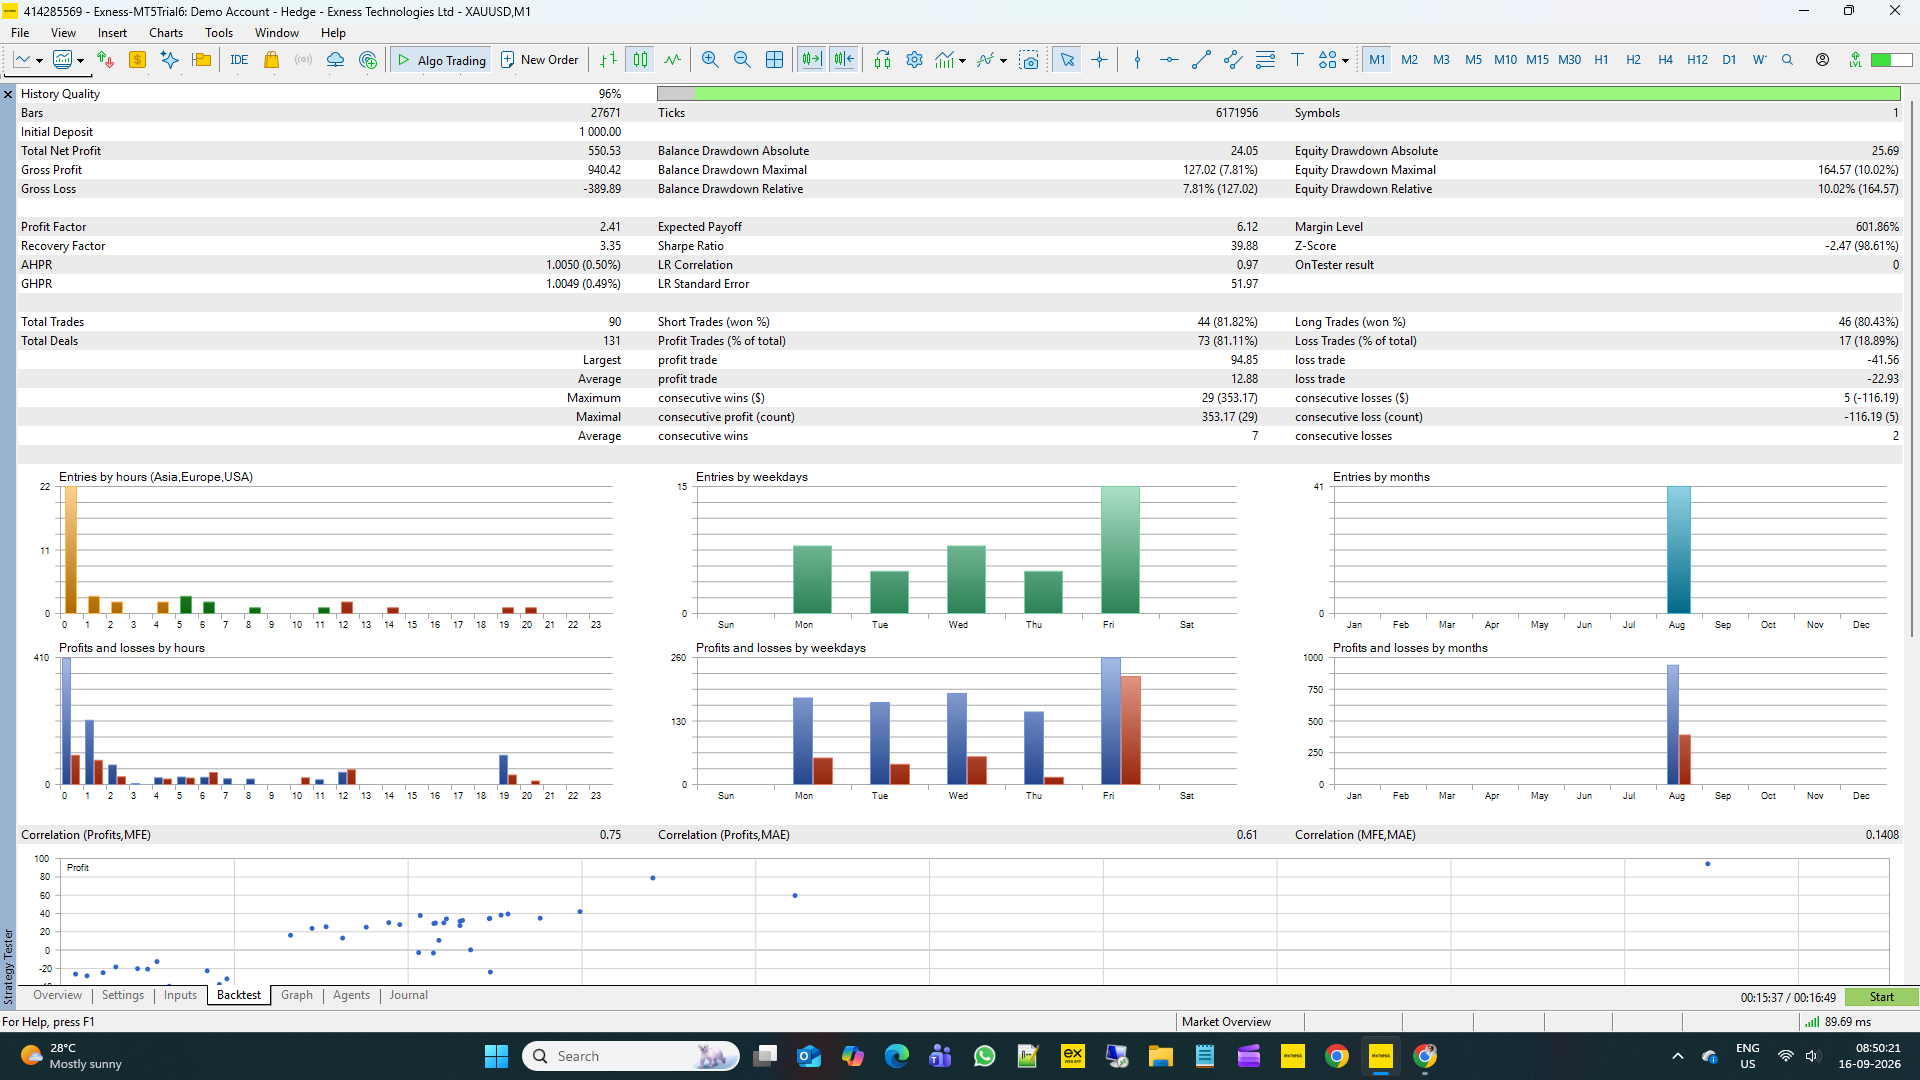
The Strategy Tester reported the following results for the XAUUSD M1 test:
| Statistic | Result |
|---|---|
| Initial Deposit | $1,000.00 |
| Total Net Profit | $550.53 |
| Gross Profit | $940.42 |
| Gross Loss | -$389.89 |
| Profit Factor | 2.41 |
| Expected Payoff | $6.12 |
| Recovery Factor | 3.35 |
| Sharpe Ratio | 39.88 |
| Total Trades | 90 |
| Total Deals | 131 |
| Profit Trades | 73 |
| Loss Trades | 17 |
| Winning Trades | 81.11% |
| History Quality | 96% |
| Bars | 27,671 |
| Ticks | 6,171,956 |
| Symbols | 1 |
The final balance shown in the Strategy Tester journal was $1,550.53.
14. Balance & Equity Drawdown
The tester reported:
Balance Drawdown
• Absolute — $24.05
• Maximal — $127.02
• Relative — 7.81%
Equity Drawdown
• Absolute — $25.69
• Maximal — $164.57
• Relative — 10.02%
The equity drawdown figure is particularly relevant because it captures the largest reported equity decline during the test rather than looking only at closed-balance movements.
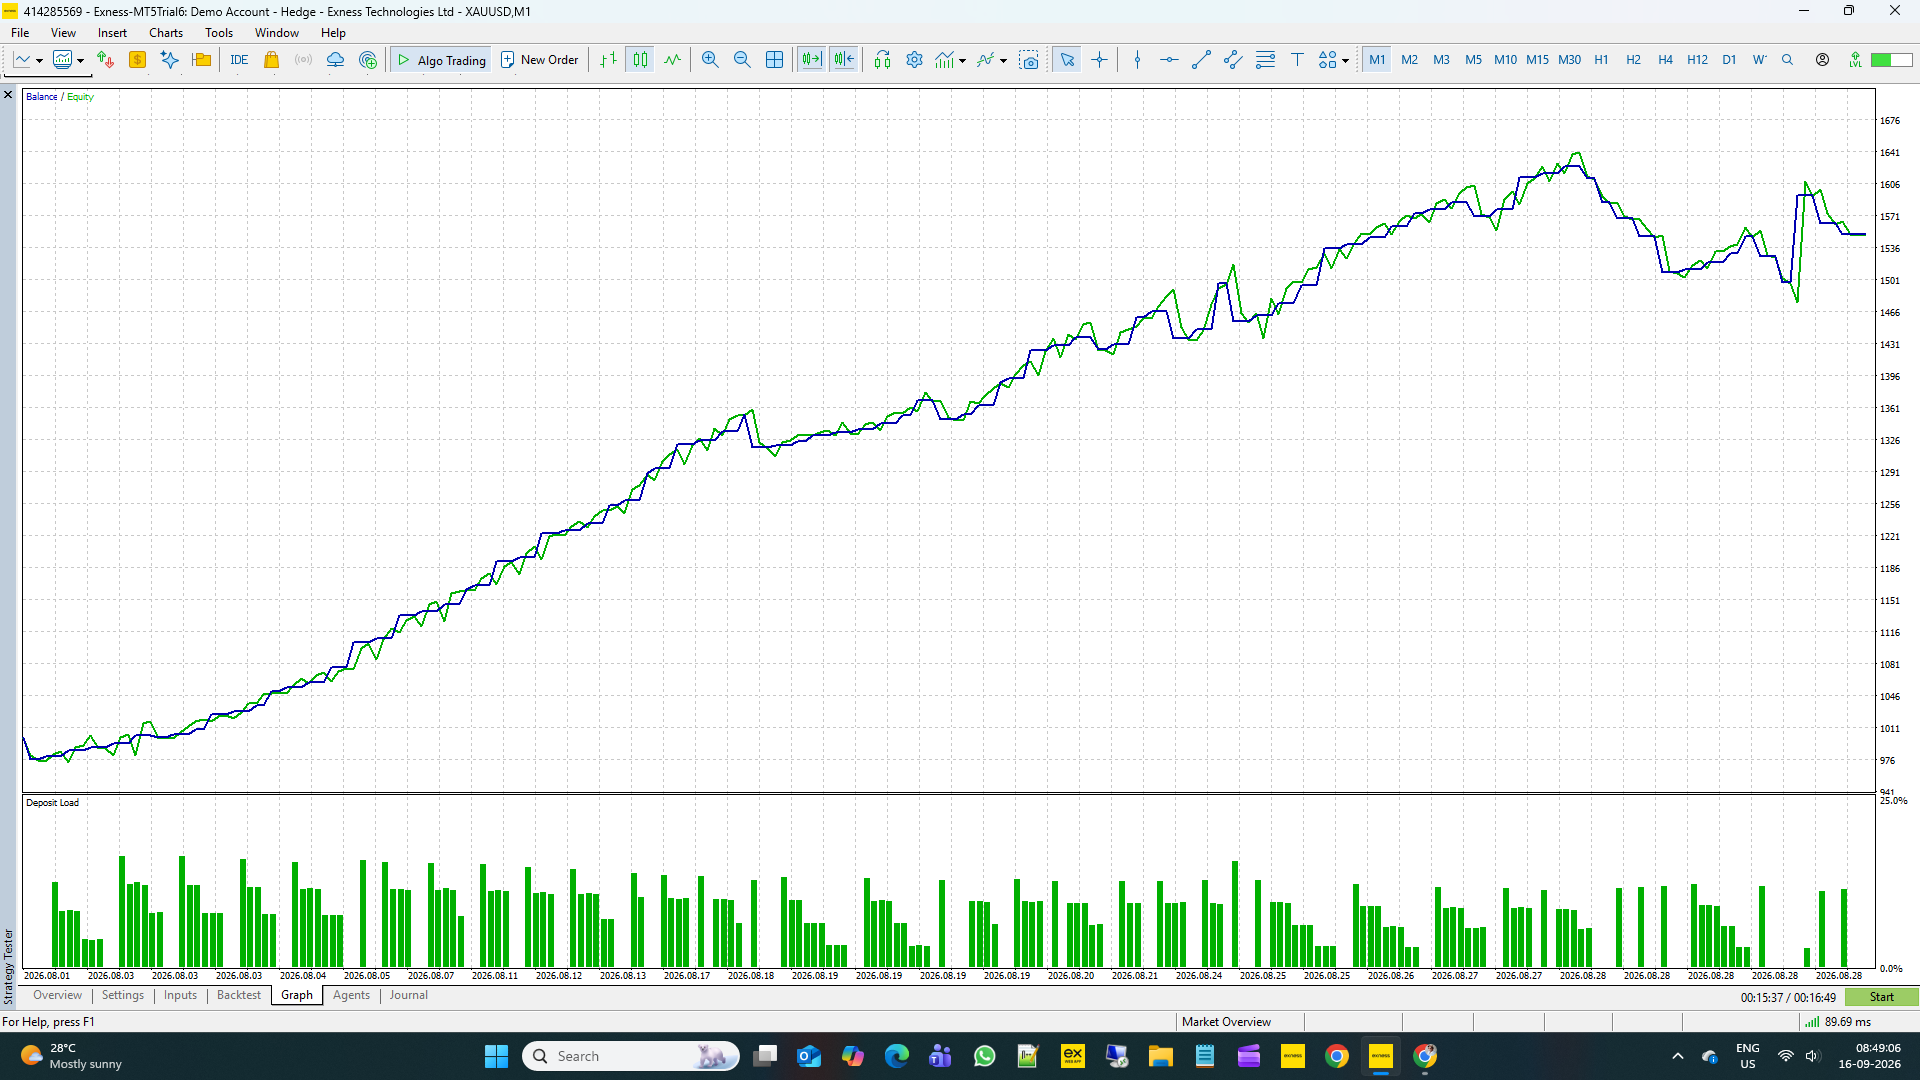
The accompanying Strategy Tester graph shows the balance and equity curves generally progressing upward during the tested August period, with several periods of pullback before recovering toward the final balance.
15. BUY vs SELL Results
The 90 completed trades were distributed between both directions:
Short Trades
44 trades
• Winning — 81.82%
• Losing — 18.18%
Long Trades
46 trades
• Winning — 80.43%
• Losing — 19.57%
This gives a relatively balanced number of BUY and SELL trades in this particular XAUUSD test rather than the result being generated predominantly by only one direction.
16. Profit & Loss Distribution
The tester reported:
Winning Trades
• Number — 73
• Average Profit Trade — $12.88
• Largest Profit Trade — $94.85
Losing Trades
• Number — 17
• Average Loss Trade — -$22.93
• Largest Loss Trade — -$41.56
The largest reported profit trade was therefore substantially larger than the largest individual loss trade in this test.
However, individual trade statistics should always be considered together with the complete sequence of trades and drawdown rather than viewed independently.
17. Consecutive Trade Statistics
The Strategy Tester reported:
• Maximum Consecutive Wins — 29 trades
• Maximum Consecutive Losses — 5 trades
• Maximum Consecutive Profit — $353.17
• Maximum Consecutive Loss — -$116.19
• Average Consecutive Wins — 7
• Average Consecutive Losses — 2
These statistics describe the historical sequence of this particular August XAUUSD test and should not be interpreted as an expectation for future trade sequences.
18. Historical Test Curve
The Strategy Tester graph shows a generally progressive balance/equity development from approximately the initial $1,000 level toward the final $1,550.53 balance.
The curve also contains several visible pullbacks, including periods during the latter part of August where equity and balance temporarily declined before recovering.
This is useful because the report does not present the test as a perfectly smooth curve. The historical path itself contains both advances and drawdowns.
19. Trading Activity During August
The Strategy Tester activity charts show trades distributed across the tested period, with activity occurring primarily during the enabled broker-time session.
The weekday distribution also shows trading activity across multiple weekdays, with Friday showing the highest number of entries in this particular test.
The monthly distribution is naturally concentrated in August 2026, because that is the only month included in the custom testing period.
These distributions describe the specific test configuration and should not be generalized to other periods without additional testing.
20. What This XAUUSD Test Demonstrates
This historical test provides a concrete example of how MSX AI Multi Symbol Scalper v2.10 behaved on XAUUSD using the documented M1 configuration during August 2026.
Among the reported characteristics were:
$550.53 net tester profit
2.41 Profit Factor
81.11% profitable trades
10.02% maximum reported equity drawdown
90 total trades
Both BUY and SELL directions represented
96% reported History Quality
The test also demonstrates that the EA's execution, risk, capital-allocation, session and trade-management controls were active within the tested configuration.
21. What This Test Does NOT Demonstrate
This point is equally important.
The XAUUSD result does not demonstrate the performance of the complete MSX AI Multi Symbol Scalper portfolio.
It is:
One symbol
One timeframe — M1
One historical period — August 2026
One specific configuration
One Strategy Tester environment
The Strategy Tester cannot reproduce the complete multi-symbol portfolio behaviour involving simultaneous operation of multiple symbols and independent directional engines.
Therefore, the $550.53 net profit should not be presented as the expected return of the complete portfolio.
Likewise, the reported 10.02% maximum equity drawdown should not be assumed to be the maximum drawdown of a multi-symbol portfolio.
22. Why the M1 Timeframe Is Used for This XAUUSD Study
For this symbol-specific analysis, M1 was the selected XAUUSD test timeframe.
The purpose of this report is not to claim that M1 is universally the best timeframe for Gold.
Instead, M1 is simply the timeframe used for this documented XAUUSD Strategy Tester study.
Different timeframes and configurations can produce different trading behaviour and should be evaluated independently.
23. Reproducibility
Users wishing to independently study this historical test can use the following core conditions:
EA: MSX AI Multi Symbol Scalper v2.10
Symbol: XAUUSD
Timeframe: M1
Period: 01 August 2026 – 31 August 2026
Initial Deposit: $1,000 USD
Leverage: 1:100
Modeling: Every tick based on real ticks
Forward: No
Optimization: Disabled
Execution Delay: 88 ms
The detailed screenshots in this report document the principal EA inputs used for the test.
For exact reproduction, users should use the corresponding complete parameter configuration rather than relying only on selected values displayed in this article.
24. XAUUSD in the 12-Symbol Analysis Series
This XAUUSD report is part of the broader:
MSX AI Multi Symbol Scalper — 12-Symbol Strategy Tester Analysis Series
The series is designed to provide a consistent analytical structure across different asset classes.
The planned reports include:
• BTCUSD — Cryptocurrency
• XAUUSD — Gold
• EURUSD — Forex
• GBPUSD — Forex
• USDJPY — Forex
• US30 — Index
• NAS100 — Index
• US500 — Index
• USOIL — Commodity
• GER40 — Index
• UK100 — Index
• XAGUSD — Silver
Each individual report examines its own symbol and historical testing environment.
25. Final Assessment of This Historical XAUUSD Test
The August 2026 XAUUSD M1 Strategy Tester run produced a $550.53 net tester profit from a $1,000 initial balance, with a reported Profit Factor of 2.41, 81.11% profitable trades, and 10.02% maximum equity drawdown.
The test contained 90 trades, with BUY and SELL activity relatively evenly represented.
The results provide useful historical information about the behaviour of this particular MSX AI Multi Symbol Scalper v2.10 configuration on XAUUSD.
At the same time, the test is only one month and one symbol. It should therefore be treated as a symbol-specific historical reference, not as evidence of future performance or a substitute for broader testing.
For traders evaluating the EA, the most meaningful next step is to examine the other symbol reports, compare their configurations and historical characteristics, and then perform independent Demo/forward testing under their own broker environment.
Important Risk & Performance Disclosure
This article presents historical MetaTrader 5 Strategy Tester results only.
The results are not live trading results, account statements, investment results, performance guarantees or predictions of future performance.
Historical Strategy Tester performance can differ from live trading because of spreads, commissions, slippage, liquidity, execution conditions, broker specifications, historical data and future market conditions.
A single-symbol result does not represent the performance of the complete multi-symbol portfolio.
Past testing results do not guarantee future results.
Users should independently evaluate the EA, test appropriate configurations on a Demo account and understand the associated trading risks before considering live deployment.
XAUUSD M1 — August 2026 at a Glance
Initial Balance: $1,000.00
Final Balance: $1,550.53
Net Tester Profit: $550.53
Profit Factor: 2.41
Total Trades: 90
Profitable Trades: 81.11%
Maximum Equity Drawdown: 10.02%
History Quality: 96%
Testing Model: Every tick based on real ticks
This is a historical test. Study the complete configuration and statistics before drawing your own conclusions.
#XAUUSD #GoldTrading #GoldEA #GoldScalping #AlgorithmicTrading #AutomatedTrading #TradingStrategy #ForexStrategy #ExpertAdvisor #MetaTrader5