MSX AI Multi Symbol Scalper — 12-Symbol Strategy Tester Analysis Series | Study, Compare & Evaluate

A Symbol-by-Symbol Look Inside a Multi-Asset Portfolio Trading Architecture
Modern automated trading should not be evaluated from a single attractive number or one isolated backtest.
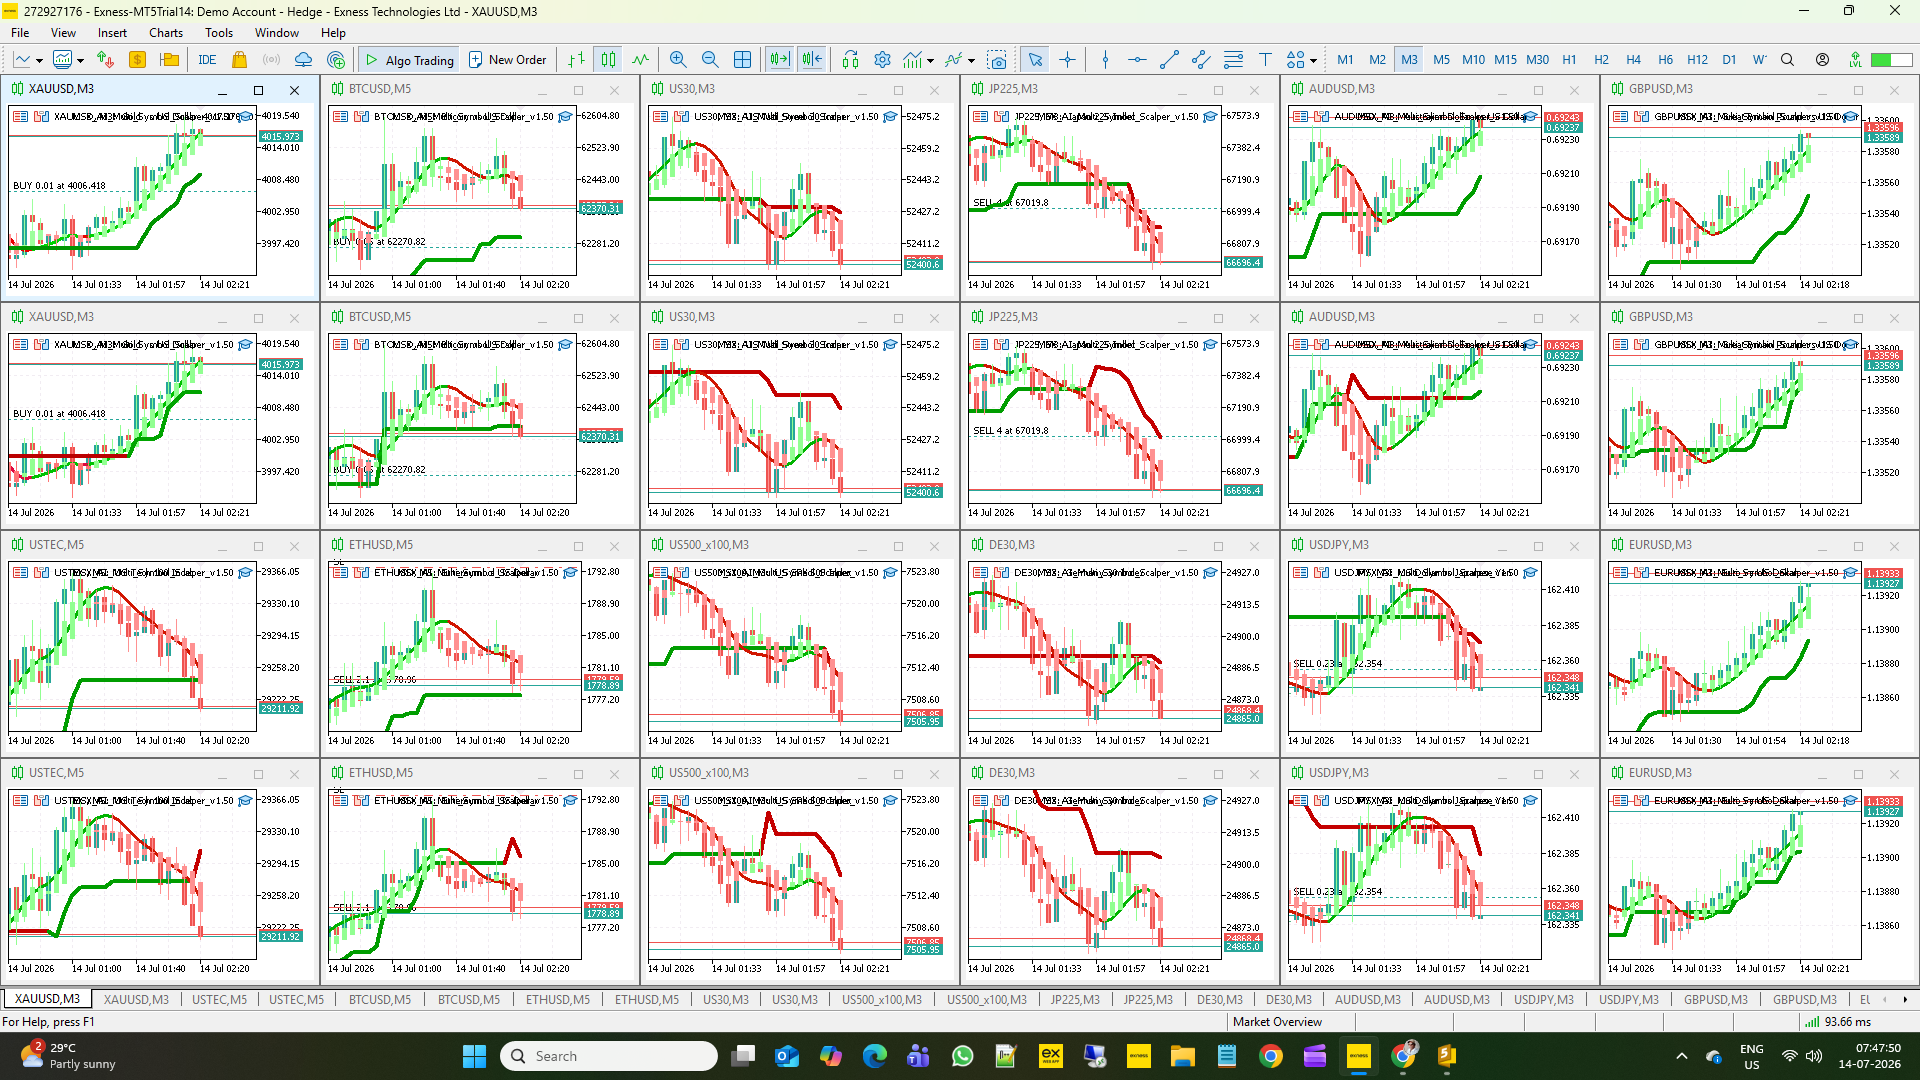
MSX AI Multi Symbol Scalper is designed as a multi-symbol portfolio Expert Advisor for MetaTrader 5, where individual symbols can be operated through independent BUY ONLY and SELL ONLY Engines. With up to 12 symbols/assets, the architecture can provide up to 24 independent directional trading engines within one portfolio deployment.
But there is an important limitation:
MetaTrader 5 Strategy Tester evaluates one symbol at a time.
Therefore, a single-symbol test cannot reproduce the complete multi-symbol portfolio environment, including simultaneous symbol activity, shared capital allocation and portfolio-level interactions.
Instead of hiding this limitation, this series is designed around it.
Why a 12-Symbol Analysis Series?
We are publishing a dedicated sequence of symbol-by-symbol Strategy Tester analysis reports so that interested traders can examine the historical testing characteristics of individual assets using a consistent reporting structure.
Each report focuses on one symbol and documents the relevant test environment, configuration and available Strategy Tester statistics.
The objective is simple:
Study → Compare → Reproduce → Evaluate → Decide
Rather than asking traders to rely only on a general product description, the series provides a deeper look at how the EA behaved during the documented historical test period for each selected symbol.
What Will Each Report Show?
Depending on the symbol and available tester data, each analysis can examine:
• Strategy Tester configuration
• Symbol and timeframe
• Historical test period
• Initial deposit and leverage
• BUY/SELL configuration
• Entry and trend parameters
• Hard Reversal Exit configuration
• Soft Reversal and trade-management settings
• Stop Loss / Take Profit configuration
• Partial Profit Management
• Risk and capital-management settings
• Session and protection settings
• Balance and Equity development
• Total trades and winning/loss distribution
• Profit Factor and other tester statistics
• Balance and Equity Drawdown
• Trade distribution and additional tester measurements
• Key observations and limitations
This approach allows readers to look beyond a single headline result and examine the complete testing context.
Available Symbol Analysis Reports
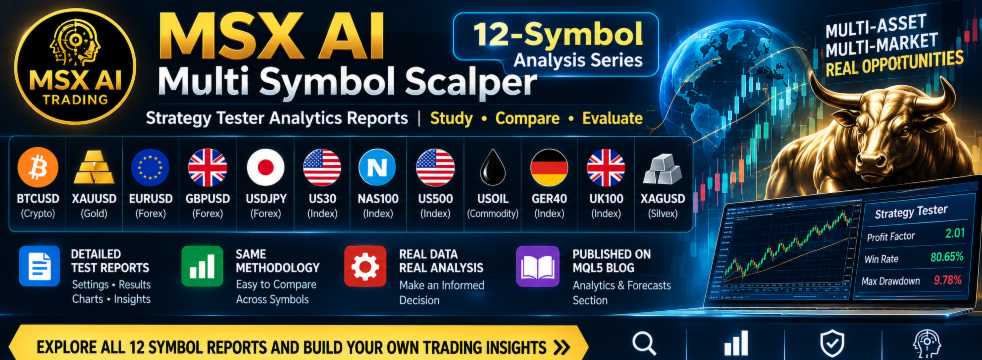
The planned series covers up to 12 symbols/assets:
1. BTCUSD — Strategy Tester Analysis
Cryptocurrency
2. XAUUSD — Strategy Tester Analysis
Gold
3. EURUSD — Strategy Tester Analysis
Forex
4. GBPUSD — Strategy Tester Analysis
Forex
5. USDJPY — Strategy Tester Analysis
Forex
6. US30 — Strategy Tester Analysis
Index
7. NAS100 — Strategy Tester Analysis
Index
8. US500 — Strategy Tester Analysis
Index
9. USOIL — Strategy Tester Analysis
Commodity
10. GER40 — Strategy Tester Analysis
Index
11. UK100 — Strategy Tester Analysis
Index
12. XAGUSD — Strategy Tester Analysis
Silver
As each report becomes available, this master article can serve as the central index for the complete series.
One Methodology — Different Market Characteristics
An important purpose of this series is comparability.
The reports are intended to follow a consistent analytical structure rather than presenting unrelated backtests with different styles of reporting.
At the same time, the symbols themselves are fundamentally different markets.
BTCUSD, Gold, Forex pairs, indices, oil and silver can exhibit different volatility, liquidity, spread characteristics, trading sessions and price behaviour.
Therefore, the purpose is not to declare one symbol “the best.”
The purpose is to allow traders to examine the characteristics of each individual test and form their own conclusions.
Single-Symbol Test vs. Complete Portfolio
This distinction is particularly important.
A symbol-specific Strategy Tester report represents the behaviour of the EA under the specific symbol, timeframe, historical period and configuration tested.
It does not represent the performance of a complete 12-symbol portfolio.
The full MSX AI Multi Symbol Scalper architecture is designed to operate multiple independent instances across symbols, timeframes and trading directions, while the account environment is shared between those instances.
Consequently, portfolio-level behaviour can differ from the result of testing any individual symbol in isolation.
This is why these reports should be viewed as individual analytical references, not as a substitute for complete portfolio testing.
From Backtest Evidence to Your Own Evaluation
The purpose of publishing these reports is not to tell a trader what decision to make.
It is to provide more information for making that decision.
An interested trader can:
1. Read the individual symbol report
Understand what was tested and during which period.
2. Examine the configuration
Review the timeframe, risk settings, entry/exit configuration and protection parameters.
3. Study the complete statistics
Look at profitability, drawdown, trade frequency, winning/loss distribution and other available tester measurements.
4. Compare different symbols
Identify how the historical characteristics differ between assets.
5. Reproduce the test where appropriate
Use the documented conditions and available configuration information for independent verification.
6. Continue with Demo/forward testing
Evaluate the full EA under the trader's own broker, symbol specifications and execution environment.
7. Then make an informed Rent or Buy decision
The final decision remains with the trader.
Why Transparency Matters
A Strategy Tester result is much more useful when the reader knows how it was produced.
For this reason, the individual reports are intended to show not only selected performance statistics but also the surrounding test configuration and relevant limitations.
This is particularly important for a short-term and multi-asset trading system, where factors such as:
• Spread
• Commission
• Slippage
• Liquidity
• Execution conditions
• Broker specifications
• Historical data quality
• Timeframe
• Trading sessions
• Risk configuration
can influence actual trading behaviour.
A historical test can provide useful analytical information, but it cannot eliminate these real-world variables.
The First Report: BTCUSD
The series begins with a detailed BTCUSD Strategy Tester Analysis using the documented BTCUSD configuration and historical test period.
The BTCUSD report demonstrates the intended format for the remaining symbol studies: settings → test environment → trading configuration → results → drawdown → trade analysis → interpretation → limitations.
The same general analytical philosophy will be carried forward to the other symbols in the series.
A Research-Oriented View of MSX AI Multi Symbol Scalper
MSX AI Multi Symbol Scalper is designed not simply as a single-chart trading tool, but as a configurable multi-symbol portfolio trading framework.
Its architecture allows users to build different combinations of:
Symbols + Timeframes + BUY/SELL Direction + Risk + Capital Allocation + Sessions + Protection
The 12-Symbol Strategy Tester Analysis Series provides a symbol-level window into that larger architecture.
It is therefore best viewed as a supporting analytical resource for product evaluation, rather than as a collection of performance promises.
Important Interpretation
All results presented in this series are historical MetaTrader 5 Strategy Tester results.
They are not live trading records, account statements, investment results, performance guarantees or predictions of future market performance.
A historical result from one symbol, timeframe or testing period does not represent the performance of the complete multi-symbol portfolio.
Actual trading results may differ because of broker conditions, spreads, commissions, slippage, liquidity, execution quality, symbol specifications, historical data and future market conditions.
Users should perform their own testing and evaluation, preferably on a Demo account, before considering live deployment.
Study the Series — Make Your Own Decision
The objective of this project is straightforward:
We provide the test configuration and historical evidence. You study the data, compare the markets and make your own decision.
Whether a trader ultimately chooses to rent, test further or purchase MSX AI Multi Symbol Scalper should be based on their own evaluation, trading requirements, risk tolerance and broker environment.
Explore the individual symbol reports as they become available and build your own understanding of the MSX AI Multi Symbol Scalper portfolio architecture.
#MultiAssetTrading #TradingStrategyAnalysis #BacktestAnalysis #TradingSystemEvaluation #QuantitativeTrading #MarketResearch #TradingPerformanceAnalysis #AssetDiversification #SystematicTrading #TradingStrategyResearch