
Last Friday gold did something that looks, on a chart, exactly like a breakout. At 08:30 New York the August payrolls report landed at 162,000 new jobs against expectations of around 53,000, unemployment held at 4.1%, yields and the dollar jumped, and XAU/USD fell from roughly $4,477 to about $4,366 in minutes before settling near $4,420. Just over 2% in a single move, straight through several intraday levels that had held all week. Every one of those levels "broke". My system took none of them. That is not caution, and it is not a news filter bolted on afterwards to make the statistics look nicer. It follows from what the system means by the word breakout in the first place, and it is worth spelling out — because the difference between a level breaking and a level being broken is the single most useful thing I have learned in two years of trading gold mechanically.
A price level is a record of behaviour, not a line
A support level is worth something because a certain amount of money has been willing to defend it. When price approaches from above and buyers keep absorbing what is offered, that level accumulates history: it becomes a place where participants have repeatedly acted. Breaking it means the same participants either changed their mind or ran out of ammunition. That information is what a breakout trade is actually buying. A macro release does not break a level in that sense. It reprices the whole instrument at once. In the seconds around the print, the resting book is thin, market makers widen or step away entirely, and the price that trades through the level is not a negotiated price — it is whatever was left in the book when the imbalance arrived. Nobody defended the level, because for those few seconds there was nobody there to defend it. So the candle looks identical, and the meaning is the opposite. The chart says "the level failed". What actually happened is "the level was not tested".
What the system requires before it calls something a break
The rules that keep it out of Friday's move are the same rules that get it into the moves that pay: **The level has to exist before the catalyst.** A level formed inside the reaction to a release is a level built out of a liquidity gap. It has no history behind it, so there is nothing to break. **The break has to survive a retest.** This is the filter that does most of the work. A genuine break gets sold or bought back into, and holds. A liquidity-vacuum break gets filled back in — usually within the same hour, because the orders that were never there come back and the market discovers the real price. The retest requirement costs some of the initial move. It also removes most of the candles that look best and behave worst. **The stop belongs to the level, not to the candle.** Position size follows from where the idea is wrong, which is the other side of the level. In a news candle, "the other side of the level" can be $40 away and moving. A fixed risk model simply cannot express that trade, which is a feature. **Time is part of the exit.** Average holding time on this system is around two hours. A breakout that has not done its work inside that window is usually not a breakout, it is drift. Add those together and a payroll release is not a signal, it is a period during which signals cannot be generated. The system does not need to know that Friday was NFP. It only needs to notice that nothing on the chart met its definition of a level being taken.
August paid for exactly this
I would rather show this with my own losses than with a theory. The single worst trade of my entire two-year track record happened on 3 August: a short from $4,020 that cost €66.81, roughly 1.67% of the account. It was a countertrend fade, and it was wrong. Two days later, on 5 August, gold broke $4,120 with structure behind it, held the retest, and that long returned +3.16% in three hours — more than the worst trade of two years had cost. That is the whole shape of the strategy in one week. August's losses came from shorts faded against the trend; 14 of the 17 trades were longs; the month closed +5.02% with a profit factor of 2.53 and only eight active trading days out of twenty-one. The edge is not in being right often, although the system happens to be. It is in the losses being small enough and fast enough that one clean break pays for several of them — which only works if you refuse the breaks that cannot be measured.
The two-year record
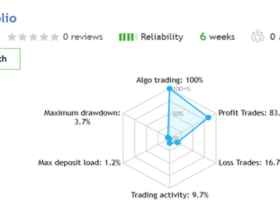
Live, verified, on one real account: **799 trades since late August 2024, +198.84%, an 80% win rate, profit factor 2.22, average 4.58% per month, maximum drawdown 15.32%**. Twenty of twenty-five closed months positive, worst month −5.64% (February 2025), best +18.84% (January 2026). One number needs explaining, because it appears in two places with two values. The MQL5 signal shows +153%, and that is the same account: MQL5 starts counting from the day the signal was published on 26 February 2026, at €1,664.59 equity. The +198.84% is the gain measured from deposits across the full history since August 2024. Both are correct — they are just measured from different starting points. Into this week The environment ahead is more of the same, and I mean that structurally rather than directionally. PPI and CPI land on 10 and 11 September, the Fed decides on 16 September, and after Friday the market is pricing roughly a 60% chance of a hike. Gold is trading around $4,400, below both its short-term averages, holding some $270 below the late-August high, with the 200-day moving average near $4,534 above and prior reaction lows around $4,319 and $4,280 below. I have no forecast to offer on which side gives way, and the system does not have one either. What I can say is that in a week with three scheduled repricing events, a large share of the candles that look like breakouts will not be breakouts, and the useful trades will most likely come *after* the releases have been digested — when levels start being defended again instead of jumped over. In an environment like this, the most profitable decision a mechanical system makes is usually the trade it does not take. You can follow AlphaEdge Smart with the full verified statistics on my profile. Questions about the rules, the filters or the numbers? Ask in the comments — I answer everyone.
Past performance is not indicative of future results. Trading leveraged instruments such as XAUUSD involves substantial risk of loss. Live results include real spreads, slippage and execution, and copied results will differ depending on broker, latency and account size.