STRATEGY COMPARE — USER MANUAL v1.10
Product links:
MT5: https://www.mql5.com/en/market/product/190477
MT4: https://www.mql5.com/en/market/product/190481
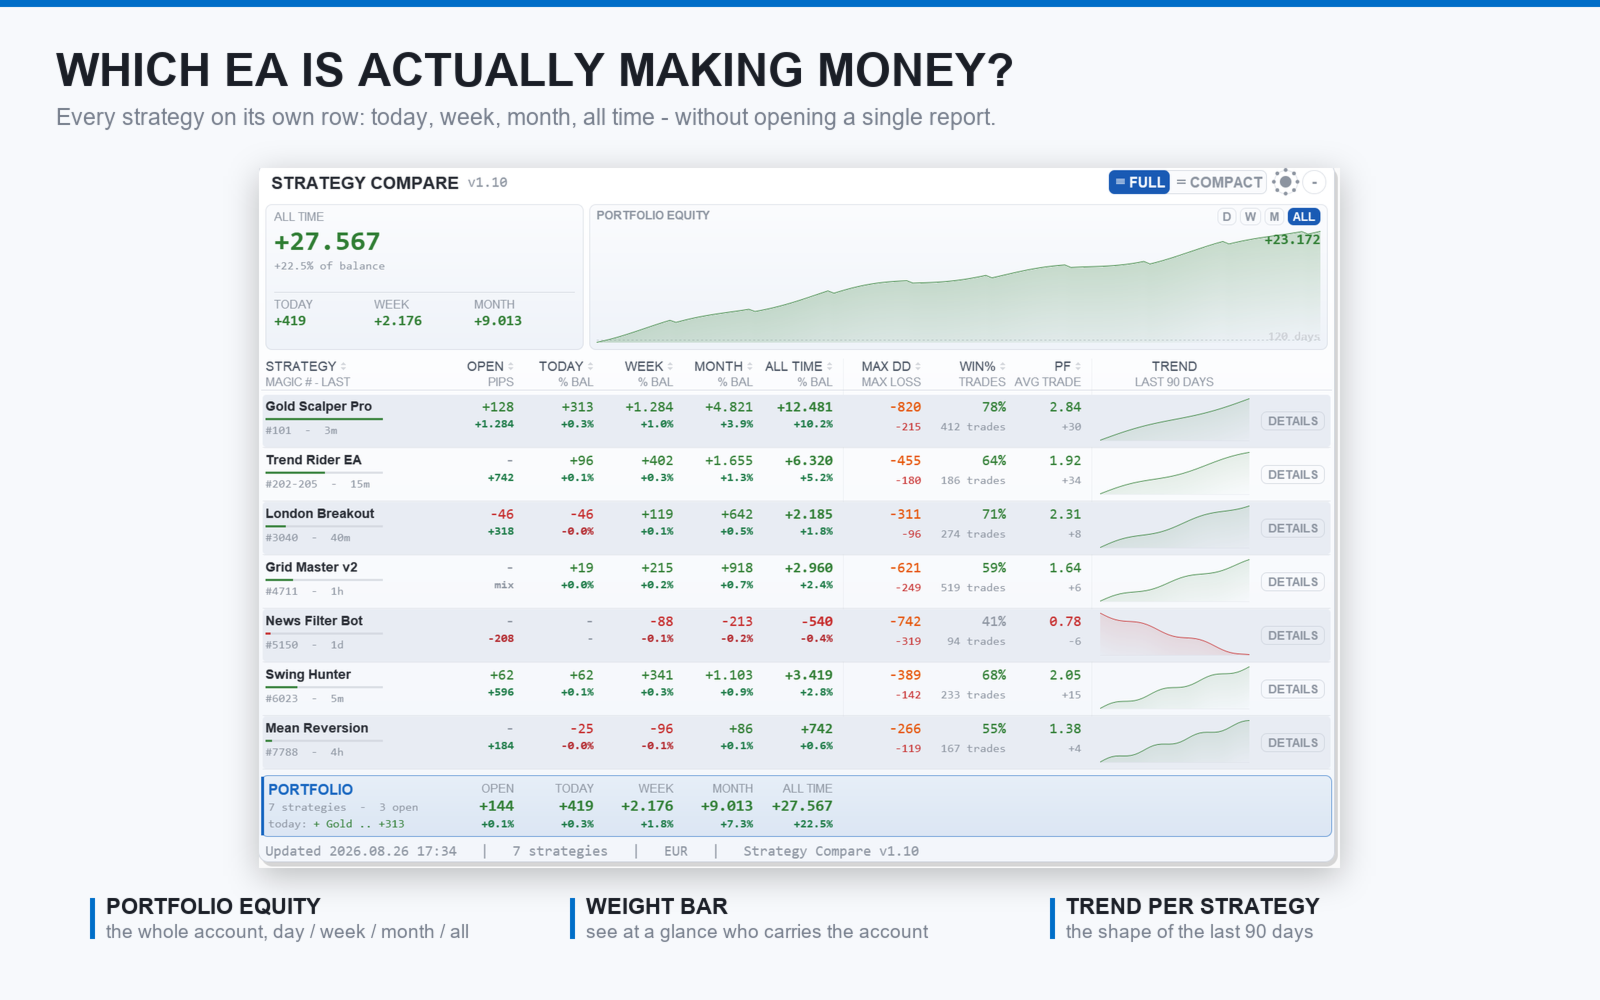
Strategy Compare answers one question: which of my Expert Advisors is actually making money? It reads the account history, splits it by magic number and puts every strategy on its own row of a live table drawn on the chart — profit by period, win rate, profit factor, drawdown, worst losing streak and an equity trend. Clicking a row opens a full statistics card for that single strategy. This manual covers version 1.10.
Every section starts with a short explanation of what that part of the panel is for, followed by the instructions and the reference tables. If you are setting it up for the first time, read sections 0 to 3 in order; the rest can be used as a reference.
0 — IMPORTANT INFORMATION
What this section is about. Strategy Compare does not trade and does not touch your positions. It only reads what your EAs have already done and shows it. Two minutes here will save you the three questions everybody asks at the first run.
- It is an indicator, not an EA. Attach it to any chart; the symbol of that chart does not matter, the table always covers the whole account.
- One instance is enough. Attaching it to several charts is allowed but pointless: they all show the same account.
- The magic number is the key. Every EA writes its own magic number on its orders; that is how the table separates them. Manual trades usually carry magic 0 and appear as one row.
- History must be loaded. The table can only show what the terminal has. In MT4, open the Account History tab and select the period you want (All History for the full picture).
- Max DD is not the same as Max Loss. Max DD is the worst floating drawdown that strategy reached while its trades were open; Max Loss is the worst run of consecutive losing trades once closed. Max DD is saved to a file, so it survives restarts.
- It does not run in the Strategy Tester in a meaningful way: there is no account history to read there.
1 — INSTALLATION
What this section is about. If you bought or downloaded the demo from the Market, MetaTrader has already installed the file for you; you only need to drag it onto a chart.
- Open the Navigator (Ctrl+N) and find Strategy Compare under Indicators / Market.
- Drag it onto any chart, or double-click it.
- In the properties window, leave the defaults for the first run and click OK.
- The dashboard appears in the top-left corner of the chart.
If the panel looks too small or too large for your screen, change Font_Size_Values: row height, column widths, charts and buttons all scale with it. If the panel is wider than the chart window, it scales itself down automatically so nothing is cut off.
2 — READING THE TABLE
What this section is about. The whole product is this table. Once you know what the two lines of each row mean, everything else is a detail.
The header shows the account total in large type and the equity curve of the whole portfolio, with a selector for D / W / M / All. Under it, one block per strategy, on two lines:
- First line: the money. Open P&L, Today, Week, Month, All Time, then Max DD, win rate, profit factor and the trend chart of that strategy.
- Second line: the context. Magic number and time since the last trade, percent of balance for each period, pips, Max Loss, the number of trades and the average trade.
- The weight bar under the strategy name shows how much that strategy weighs on the account: a long bar means it is carrying your results, for better or worse.
The bottom card is the portfolio: the same columns totalled, plus the best and the worst strategy of the period. Click any column header to sort by it; click again to reverse the order.
3 — THE TWO VIEWS
What this section is about. The panel can run wide, with every period side by side, or narrow, when you need the chart more than the table.
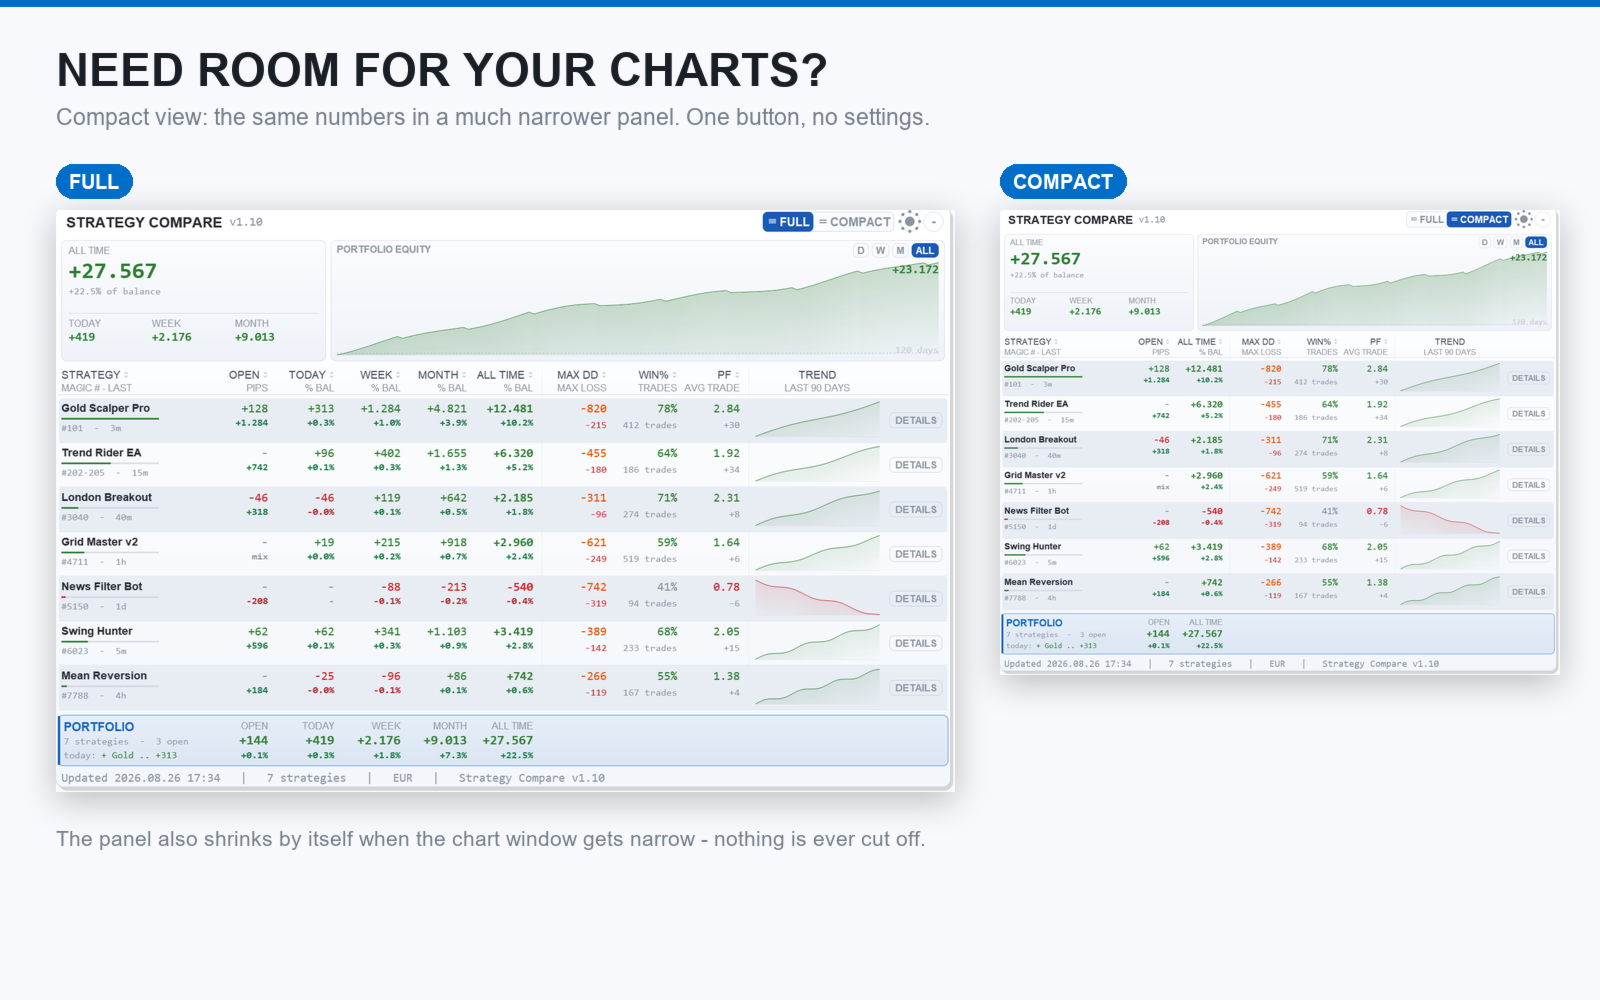
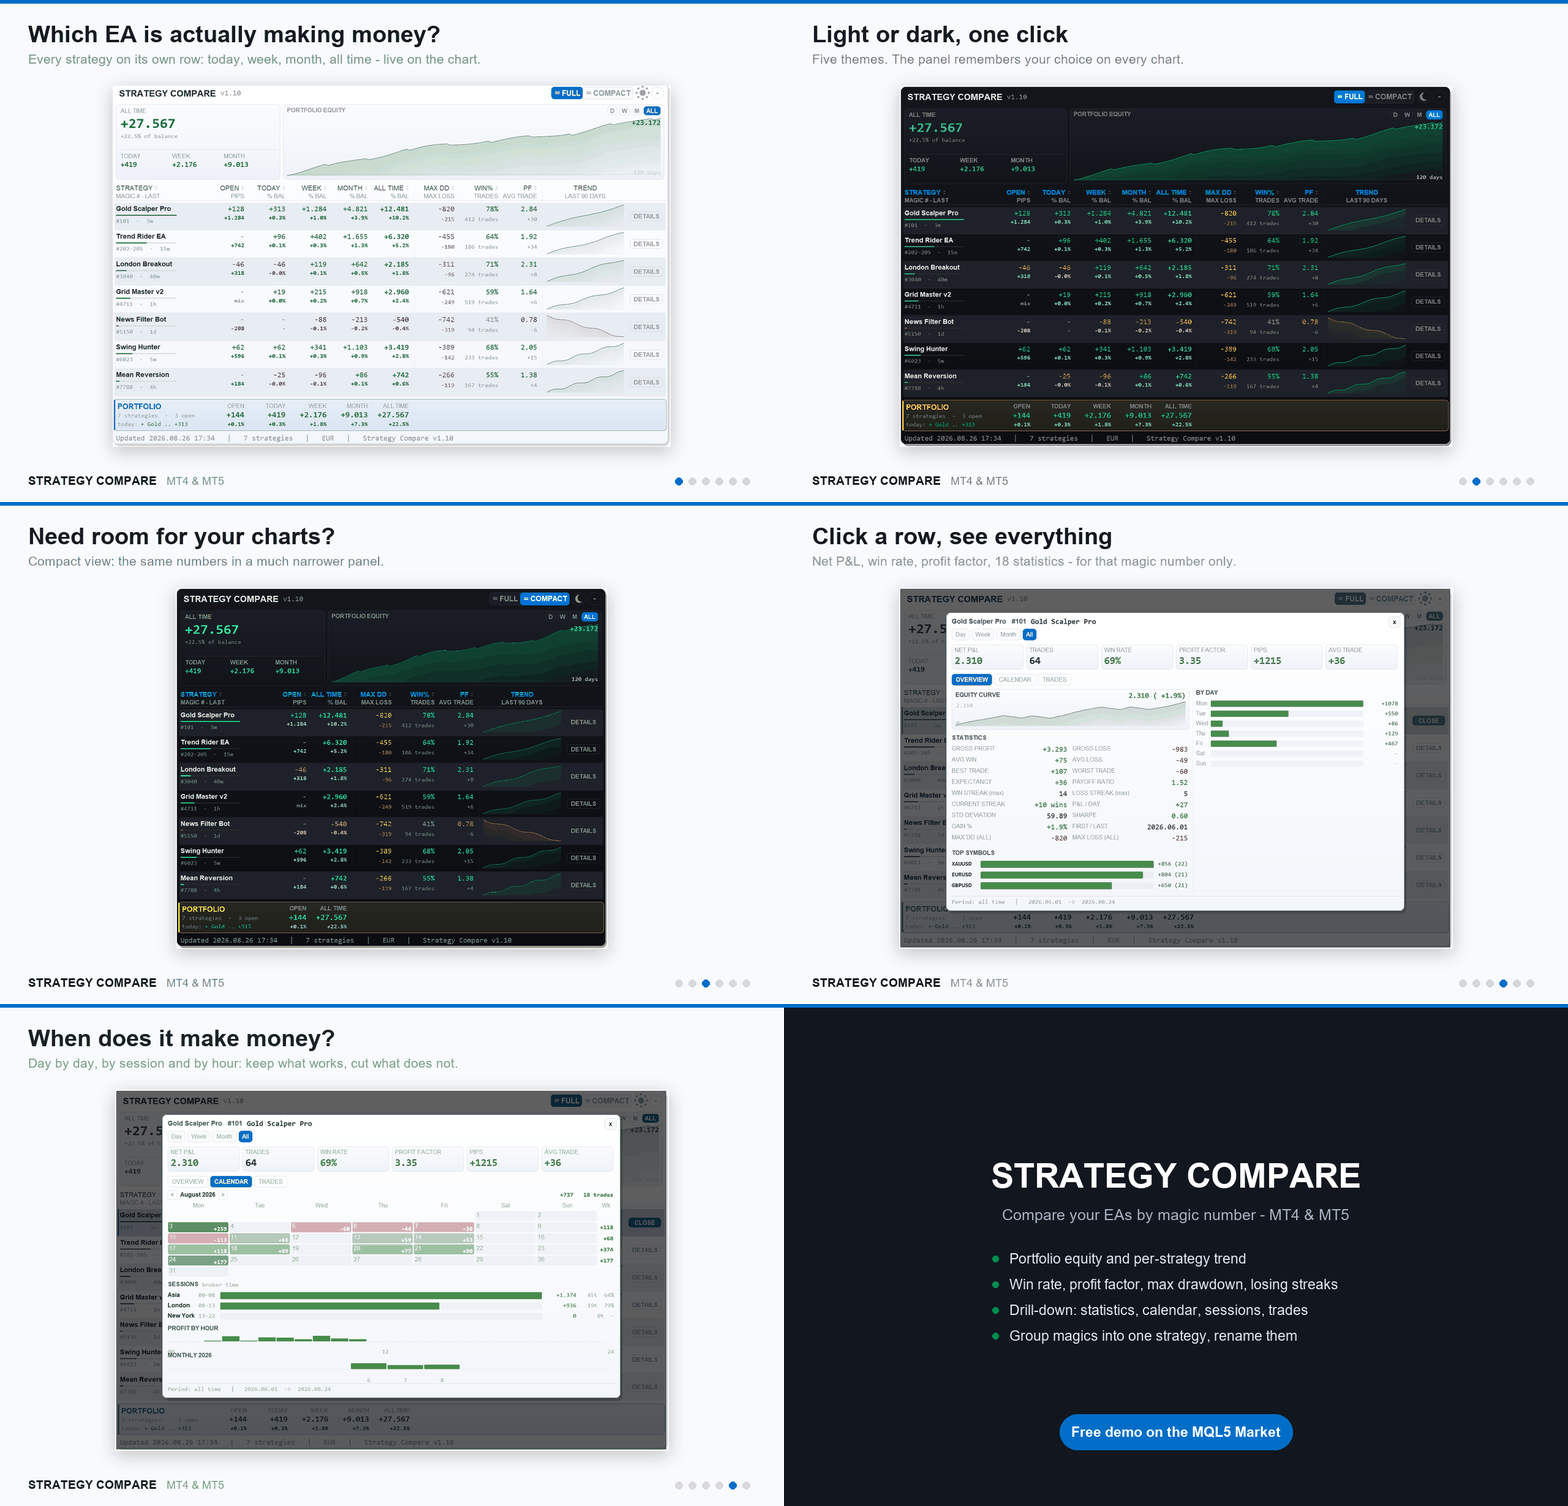
FULL shows Open, Today, Week, Month and All Time at the same time. COMPACT shows one period at a time — you choose it with the DAY / WEEK / MONTH / ALL chips in the title bar — and gives back a large part of the width. The button in the title bar switches between them and the choice is remembered for that chart.
4 — THEMES
What this section is about. The panel is drawn pixel by pixel, so it can follow the look of your chart instead of fighting it.
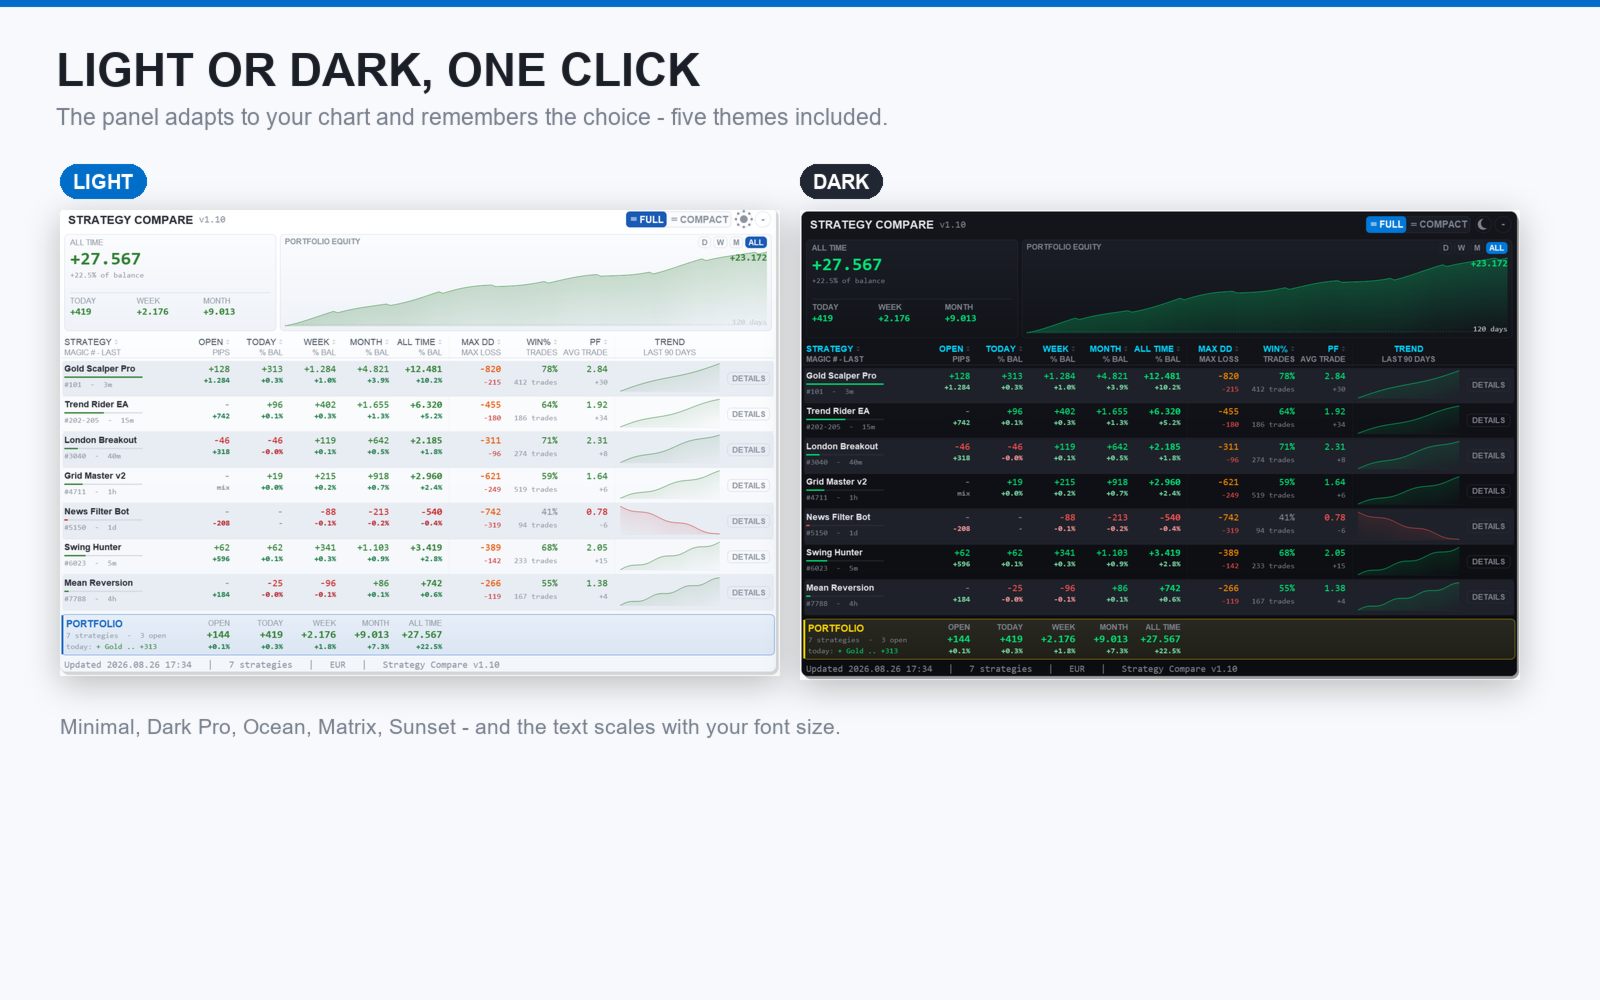
The sun/moon button in the title bar switches between the light theme and your last dark theme, and the choice is remembered per chart. Five themes are available from the Color_Theme input: Minimal (light), Dark Pro, Ocean, Matrix and Sunset. With Hide_Chart_Elements on, candles, grid and scales are hidden so only the dashboard is left on screen.
5 — THE STRATEGY CARD
What this section is about. The table tells you which strategy is worth a closer look. The card tells you why.
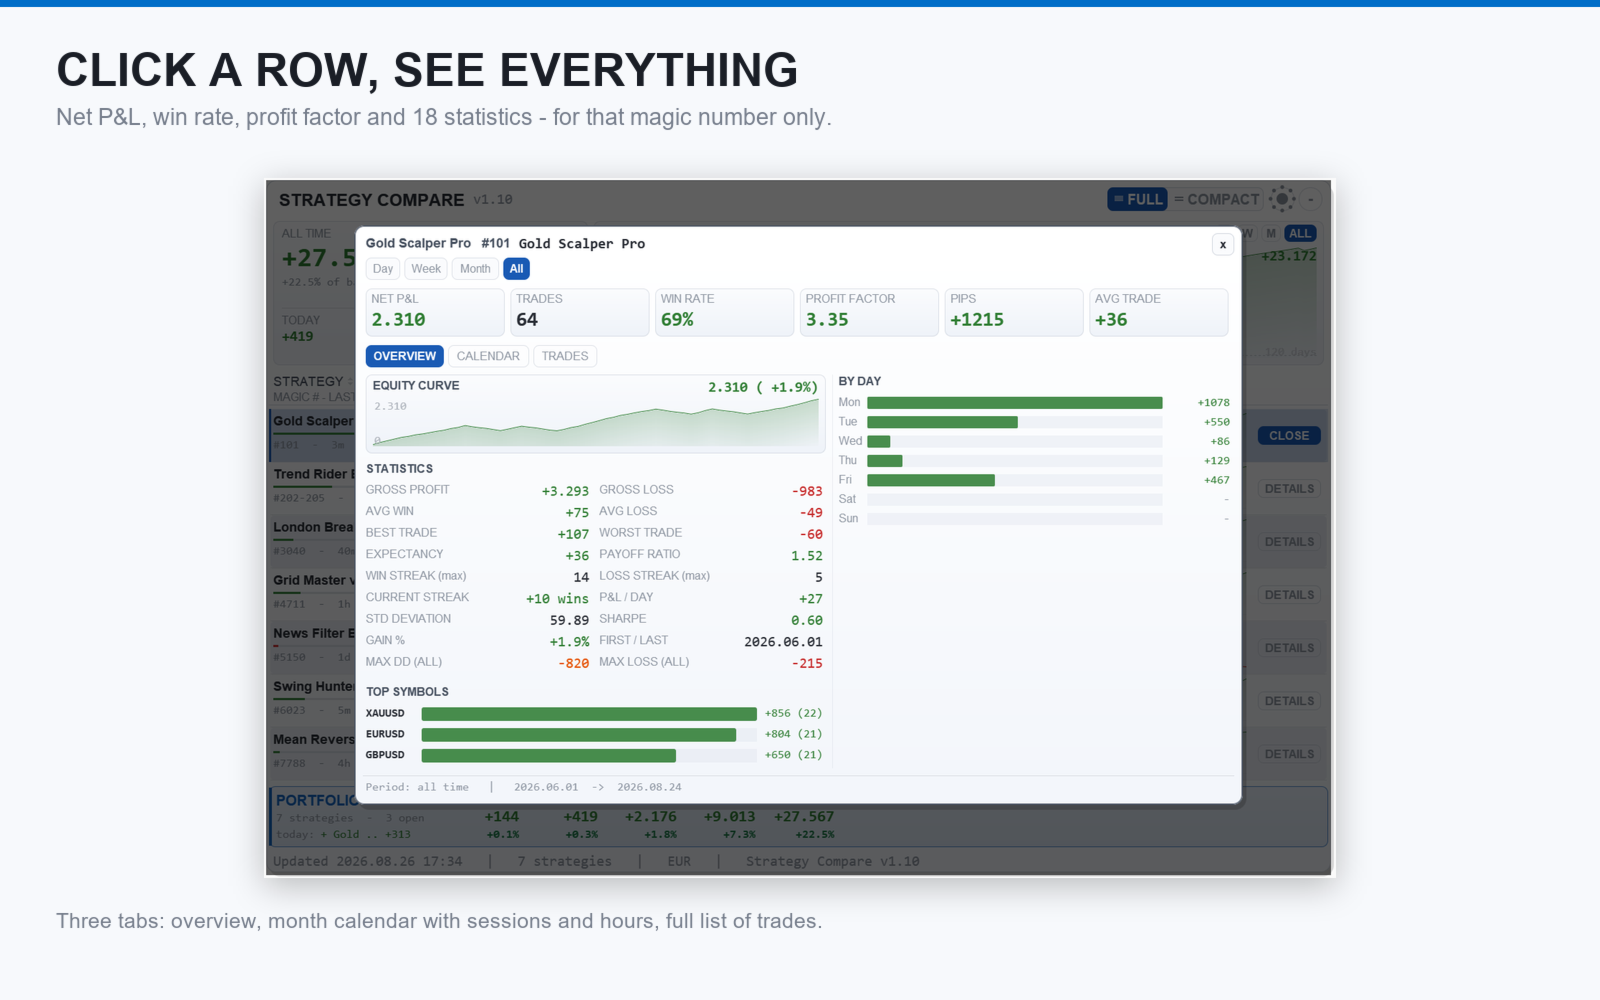
Click any row (or its DETAILS button) to open it. At the top, six figures for the selected period: net P&L, number of trades, win rate, profit factor, pips and average trade. The period chips — Day, Week, Month, All — change all of them at once. Below, three tabs:
- Overview: the equity curve of that strategy, eighteen statistics (gross profit and loss, average win and loss, best and worst trade, expectancy, payoff ratio, longest winning and losing streaks, current streak, standard deviation, P&L per day, all-time Max DD and Max Loss), the profit by day of the week and the top symbols.
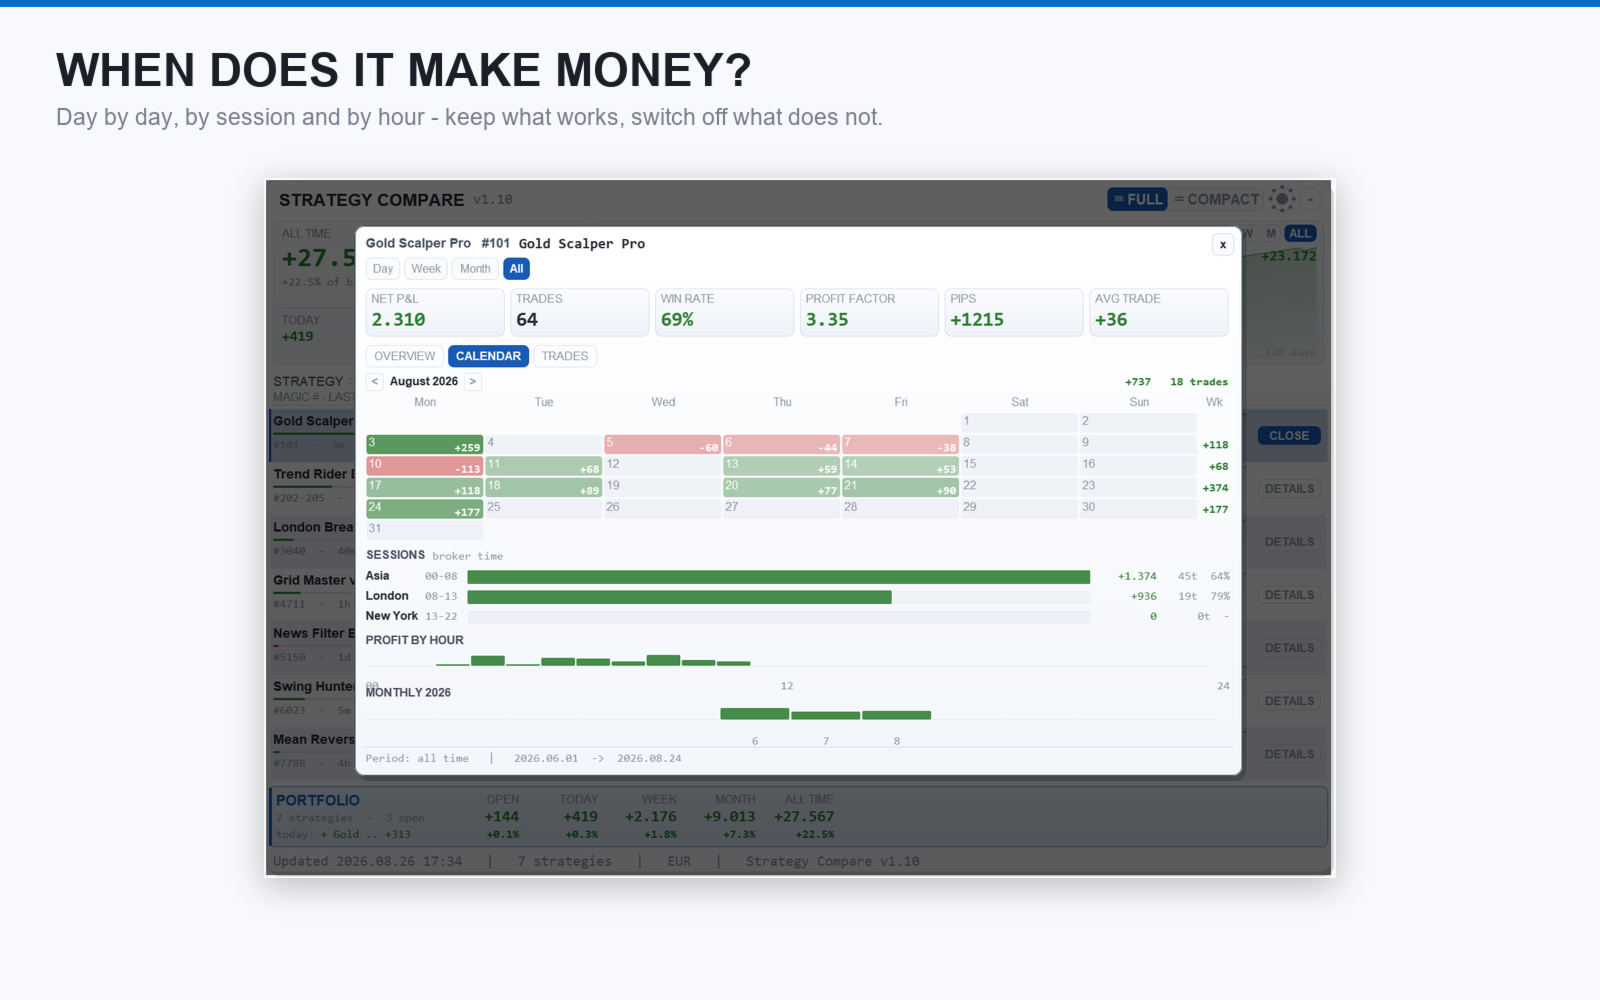
- Calendar: a month of daily results with weekly totals and month navigation, the split by trading session (Asia, London, New York), the profit by hour of the day and the monthly bars of the year.
- Trades: the latest closed trades with date, symbol, lot size, pips, money and percent.
6 — NAMING AND GROUPING MAGIC NUMBERS
What this section is about. A table of numbers is hard to read. Giving your strategies their real names takes one line of settings, and grid or basket EAs that use a range of magics can be merged into a single row.
Use the Customize_description inputs (three fields, so you can go past the 250-character limit of the properties window):
| What you want | What to write |
| Rename one magic | 123=Gold Scalper |
| Merge a range into one strategy | 8000-9000=Grid Master |
| Several rules together | 100=Scalper,8000-9000=Grid,555=News |
Two rules with the same name are merged into one row, even if the magics are far apart. A merged row is marked with an asterisk, and its Max DD is tracked from the moment you grouped it.
To show only part of the account, use Restrict_to_Specific_Magic_Numbers (single numbers or ranges, comma separated) or Exclude_Specific_Magic_Numbers. Both filters only change what is displayed: the data is always read in full.
7 — SETTINGS REFERENCE
| Setting | What it does |
| Font_Size_MainTitle / TableHeader / Values | Text size. Values also drives row height, column widths and charts. Minimum enforced: 10 / 8 / 10. |
| Magic_Number_Digits | How many characters of the magic number are shown. |
| Strategy_Name_Length | How many characters of the strategy name are shown. |
| Show_WinRate / Show_ProfitFactor | Show or hide the WIN% and PF columns. |
| Show_Account_Summary | Balance, equity, account and deposits in the header. |
| Show_Charts | The equity chart in the header and the trend chart in every row. |
| Equity_Curve_Scale | Curve points grouped by period (automatic day / week / month) or one point per trade. |
| PnL_Display | Money only, or money with the percent of balance under it. |
| CustomPipsCalcForPairs | Forces the pip size of unusual symbols, e.g. XAUUSD=2,BTCUSD=-10 . |
| Only_Show_Magic_Used_in_the_Last_Days | Hides strategies with no trade in the last X days. |
| Default_View / Color_Theme | Starting view and theme; the panel buttons override them. |
| Hide_Chart_Elements / Update_Frequency_Seconds / Max_History_Orders | Clean background, refresh rate, and how many historical deals to process. |
8 — QUESTIONS WE GET OFTEN
All my trades are on one row. Your EAs are using the same magic number, or none at all. Set a different magic in each EA; manual trades stay together on magic 0.
A strategy is missing. It has not traded within the days set in Only_Show_Magic_Used_in_the_Last_Days, or it is excluded by the magic filters, or (MT4) the Account History tab is not showing All History.
The totals do not match my balance. The header shows deposits and trading result separately: balance = deposits + trading result + floating. If the line is highlighted, some trades are being filtered out by your own settings.
Max DD looks too big. It is the worst floating drawdown ever reached by that strategy, kept in a file so it is not lost on restart. It is a memory of the worst moment, not the current situation.
Support: through the product comments or the mql5.com messaging system.