Two days ago, on 22 August, I published every qualifying XAUUSD M5 setup from a test covering 3–19 August. Today, 24 August, another setup appeared while the market was moving in real time.
That order matters. The test, its rules, its winners, breakevens and losses were already public before today's outcome existed.
The interesting part is not that this trade finished in profit. It is that the rules and historical test were already public before today's setup appeared.
The full test is here:
One trade in that article matters especially today. Trade 9 crossed 1R, but I did not move the manually managed stop to breakeven quickly enough. Gold reversed through the original stop and the trade took the full loss.
That was not a problem with hindsight analysis. It was an execution problem. It was also exactly the kind of problem Guardian was designed to reduce.
TODAY'S SETUP
Today's trade followed the same entry rules used in the published test: the trade appeared inside the 10:00–17:00 broker-time window, TrendCue Structure was bullish, and a confirmed Buy signal printed.
Guardian did not predict the move and did not trade the Smart Trend signal automatically. Its job began after my decision: plan the risk and manage the open position.
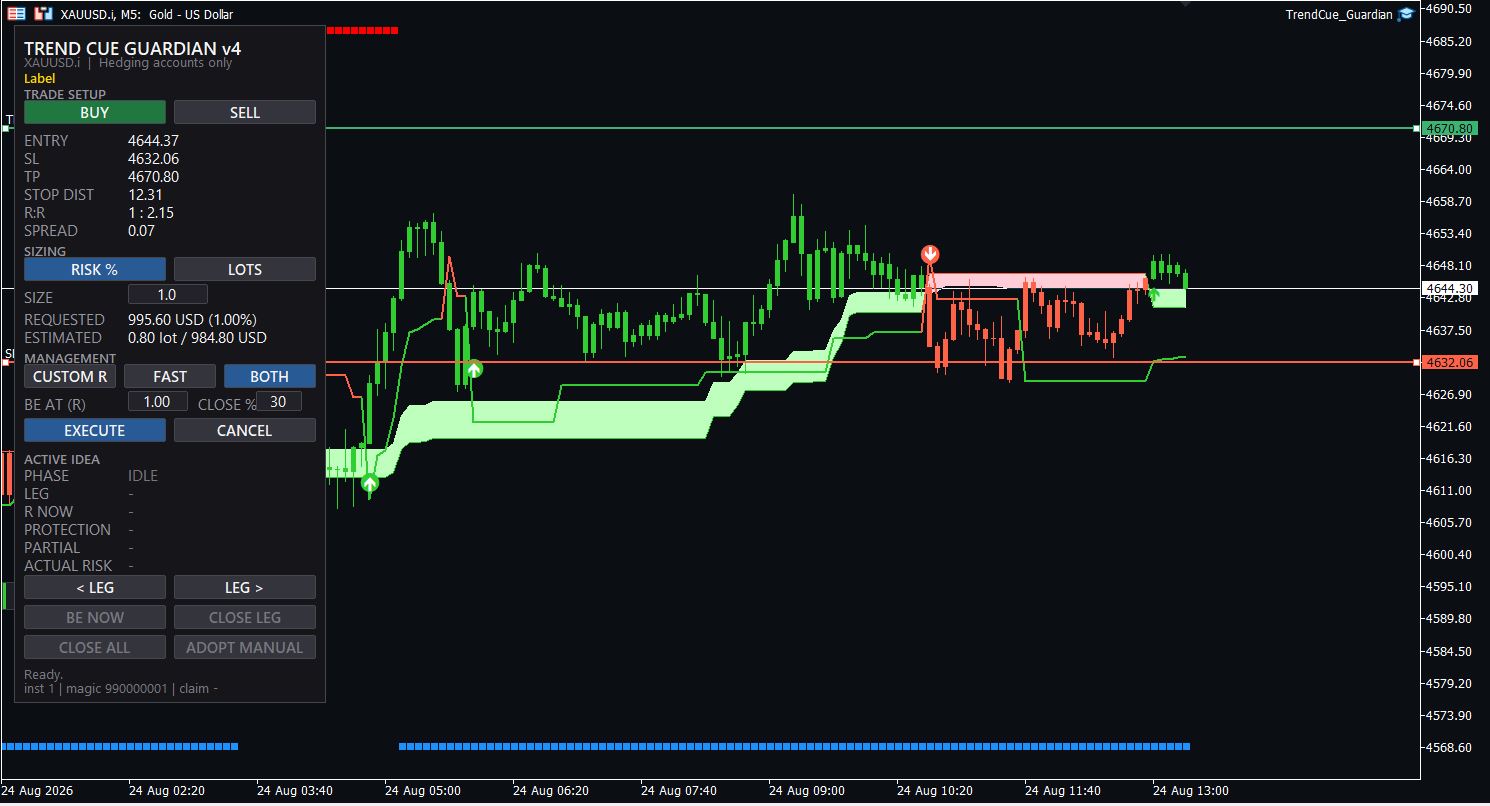
This setup matched the entry rules from my published 3–19 August XAUUSD M5 test: inside the 10:00–17:00 broker-time window, bullish TrendCue Structure, and a confirmed Buy signal. Entry was taken after the signal candle closed, with approximately 1% total planned risk.
Before execution: one XAUUSD M5 buy idea, approximately 1% total planned risk, with Guardian BOTH selected for post-entry management.
ONE RISK BUDGET, TWO MANAGEMENT PATHS
The planned risk was approximately 1% for the whole trade idea. Not 1% on each leg.
Guardian was set to BOTH. This divided the position into two legs inside the same total risk budget:
One leg followed CUSTOM R.
One leg followed FAST.
The FAST leg moved to breakeven early and then trailed the stop upward as price continued in our favor. When Gold pulled back, that protected stop was hit above entry, so the FAST leg closed in profit.
The CUSTOM R leg followed its own R-based management plan and remained open longer.
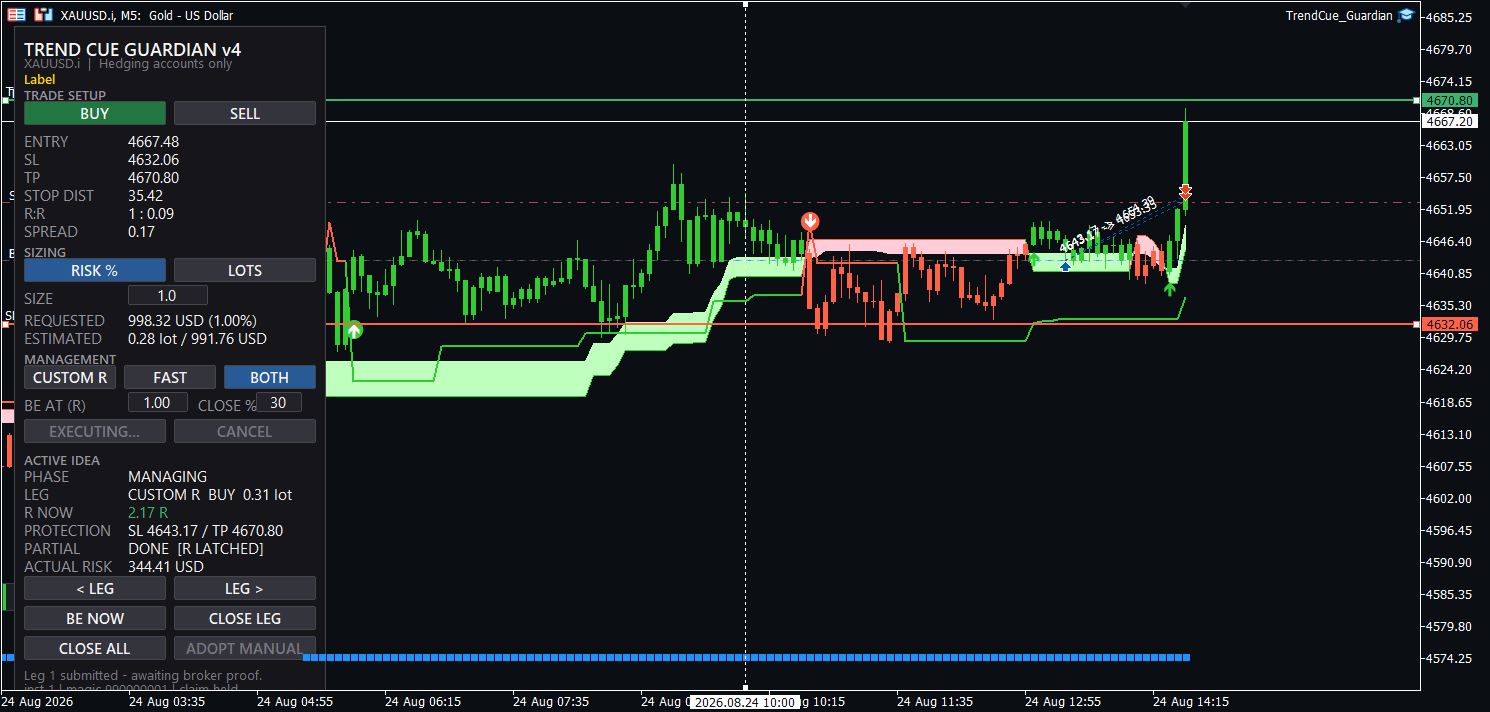
The CUSTOM R path after its partial action: the remaining leg reached 2.17R with the stop protected at entry.
The move was not a straight line. After reaching 2.17R in the screenshot above, Gold pulled back and the visible CUSTOM R reading fell to 1.22R. The protection remained at 4643.17, the position's entry price shown later in MT5 history.
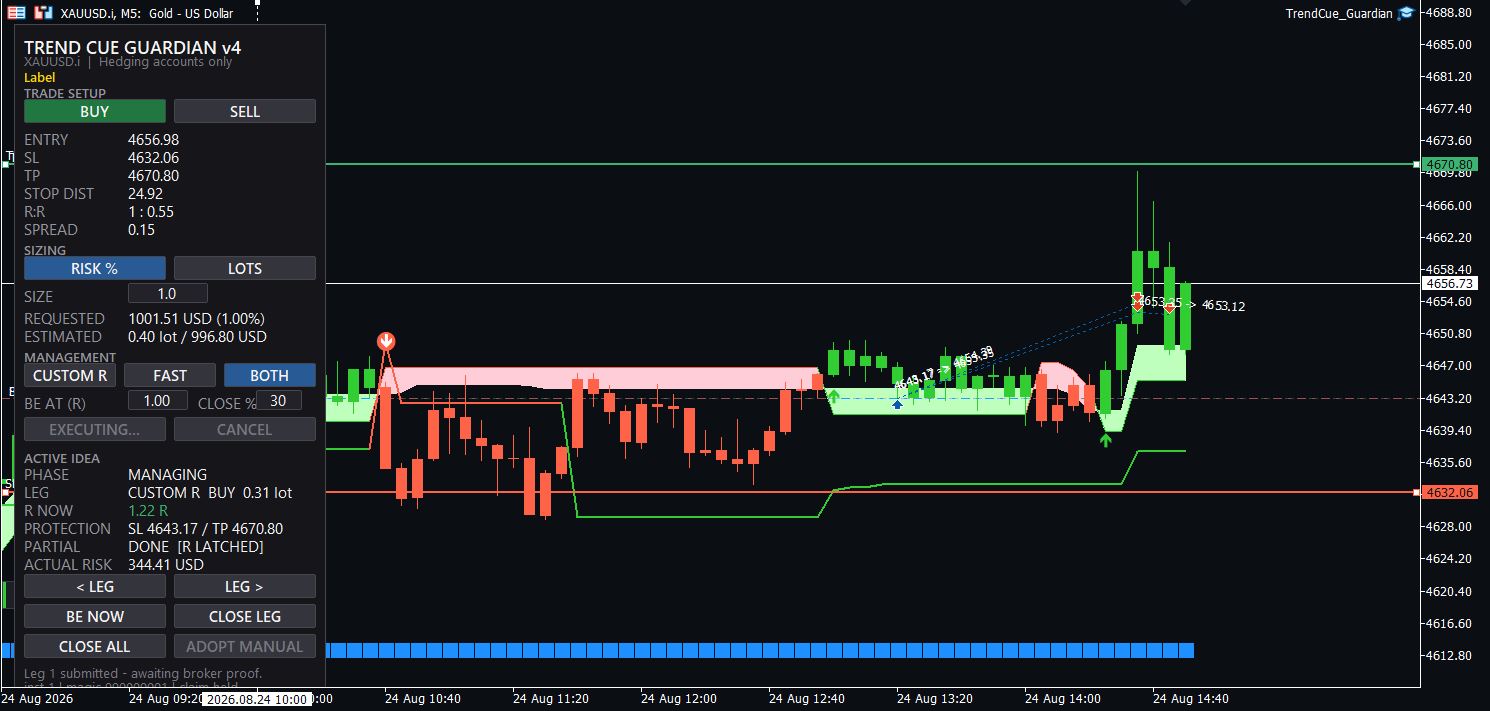
Gold pulled back, but the predefined protection remained in place. Progress was not a straight line.
THE TWO LEGS DIVERGED
The FAST path reacted more aggressively. The final history shows that its position closed at 14:46:58 after the stop had been advanced to 4653.13.
That red stop value can be misread. Both positions opened at 4643.17, so 4653.13 was already above entry. The exit was caused by the protected stop, but the result was profitable; the row shows 450.74 in the profit column.
The CUSTOM R path was allowed to continue independently. Later, Guardian still showed that leg under management at 2.36R, close to the planned target area.
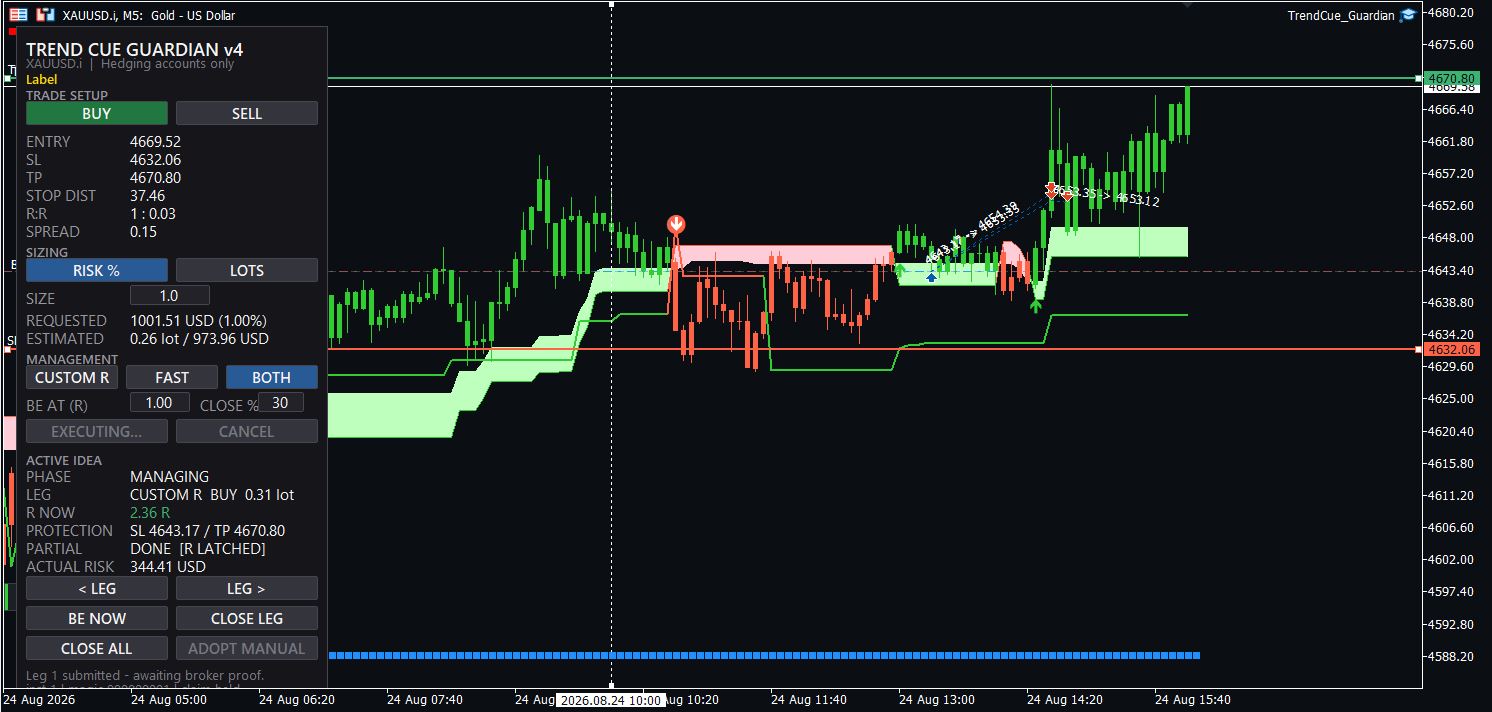
The CUSTOM R path continued independently and later reached 2.36R near the planned target.
WHAT HAPPENED
The final MT5 history is the clearest evidence. It shows two buy positions opened at 4643.17 and closed through different paths. Both rows finished in profit. The visible profit values are 1,005.18 and 450.74 in the platform's profit column.
I am not turning the displayed row percentages into an account-return claim. The screenshot does not establish the account balance needed for that calculation. It shows two profitable position outcomes, and that is the claim I am making.

Final MT5 history: two positions from the same 4643.17 entry, two different exits, and both rows closed in profit.
WHAT THIS PROVES — AND WHAT IT DOES NOT
One winning trade does not validate a strategy. It does not prove future profitability, and it does not turn a 17-trade historical test into a statistical conclusion.
What it demonstrates is narrower and more useful: a workflow documented before today's outcome could be carried into a real-time market.
Historical test → written rules → real-time decision → predefined risk → systematic management → documented outcome.
The trader still made the entry decision. Guardian handled the management actions after entry. BOTH allowed one total risk budget to follow two different management paths without doubling the planned risk.
I will continue this public journal with future qualifying setups, including the losing ones. If only the successful trades appear, the journal stops being evidence and becomes selection.
Trading involves risk. Historical results and a single real-time trade do not guarantee future performance.
The M5 examples in this journal are mainly used to make the TrendCue Smart Trend workflow easy to follow step by step. The system itself is not limited to M5.
The same Structure, Regime and Timing workflow can be applied across different symbols and timeframes. Below are the same TrendCue Smart Trend components on XAUUSD H1 and M15.
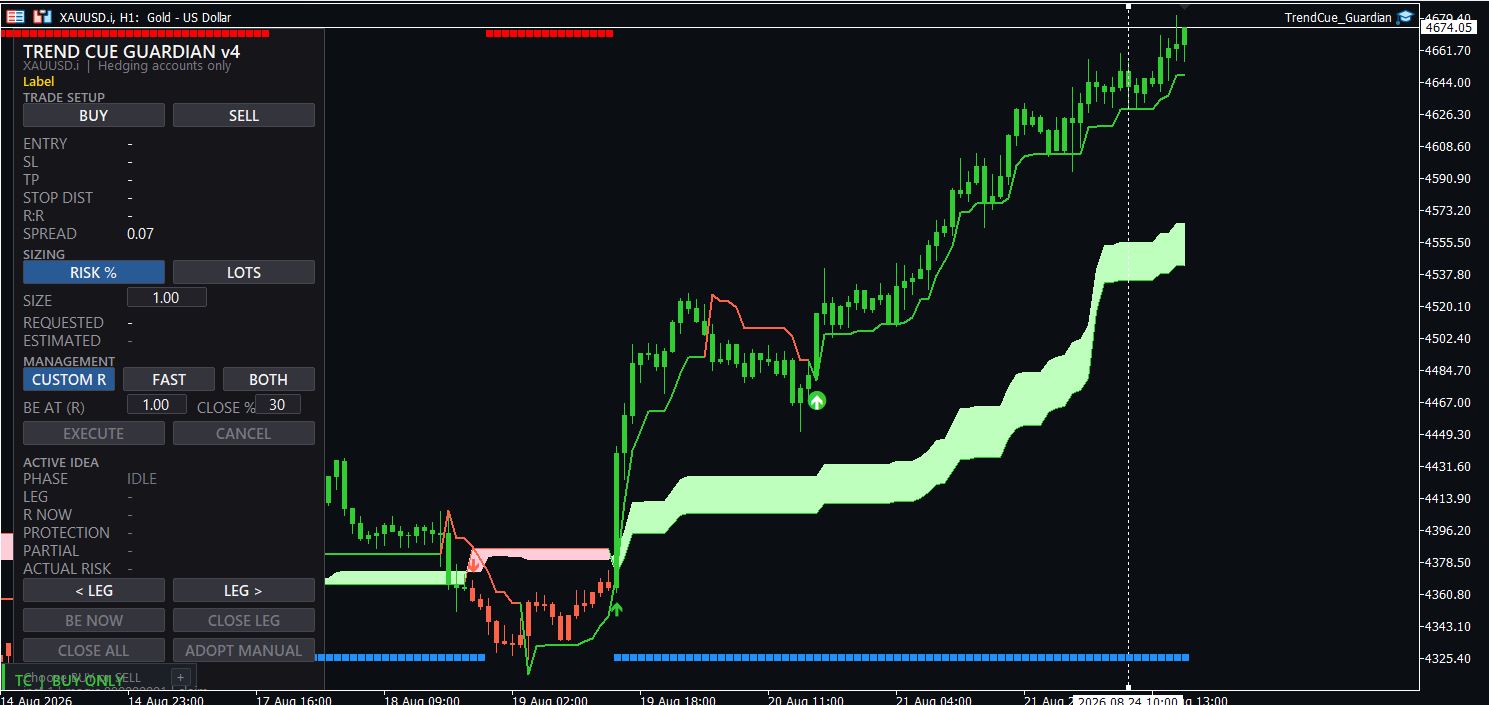
XAUUSD H1 — the same TrendCue workflow viewed on a higher timeframe.
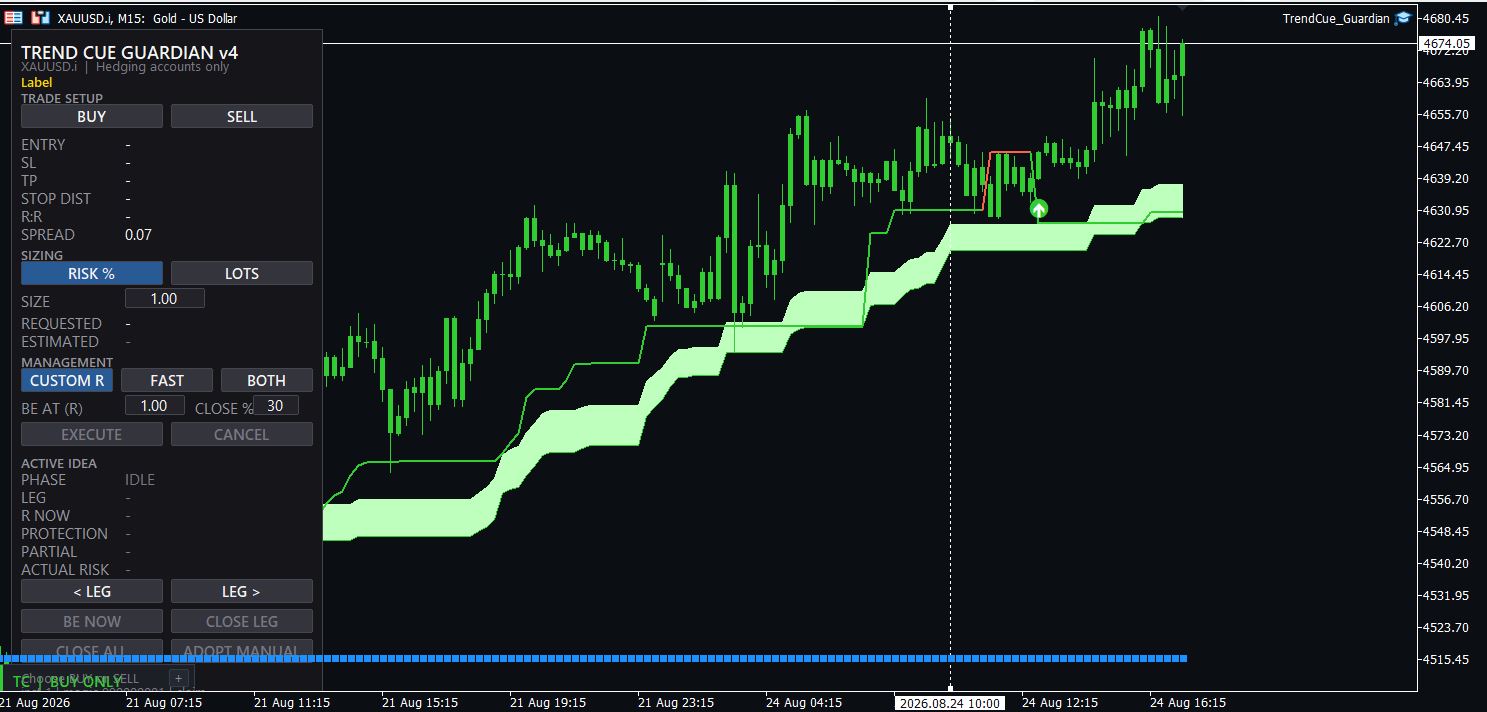
XAUUSD M15 — the same workflow on an intermediate timeframe.
If you want to see how TrendCue Smart Trend behaves on your own symbols and timeframes, you can download the demo and place it directly on your MT5 charts.
TrendCue Smart Trend:
https://www.mql5.com/en/market/product/174993





![[iVISTscalp5]: XAUUSD. Forecast First. Market Reaction Afterwards](https://c.mql5.com/6/1035/splash-preview-777232.png "[iVISTscalp5]: XAUUSD. Forecast First. Market Reaction Afterwards")
