
Apex Converge is a triangle pattern scanner for your charts. It detects triangle formations automatically, plots them directly on the chart, and highlights the exact candle where price breaks out. Works with any instrument (stocks, crypto, forex, indices) on any timeframe.
MT5-version: https://www.mql5.com/en/market/product/200424
Subscribe to my channel on MQL5.com: https://www.mql5.com/en/channels/algotrader
And to my Telegram channel, where I post new releases and sometimes free Expert Advisors and indicators: https://t.me/algotrdr
What is a triangle pattern?
A triangle appears when price action contracts into an ever-narrowing range. Highs and lows converge toward each other like a funnel. Draw one trendline across the peaks and another across the troughs, and you get the triangle. As the two lines approach each other, price typically escapes the formation with a stronger, more decisive move.
The indicator recognizes three triangle types:
✏️ Ascending triangle: a horizontal upper line and a rising lower line. Buyers keep lifting the lows, while sellers defend one and the same level at the top.
✏️ Descending triangle: a falling upper line and a horizontal lower line. Sellers keep pushing the highs down, while buyers defend a single level at the bottom.
✏️ Symmetrical triangle: a falling upper line and a rising lower line with roughly equal slopes. Neither buyers nor sellers have gained the upper hand yet.
Ascending triangle example
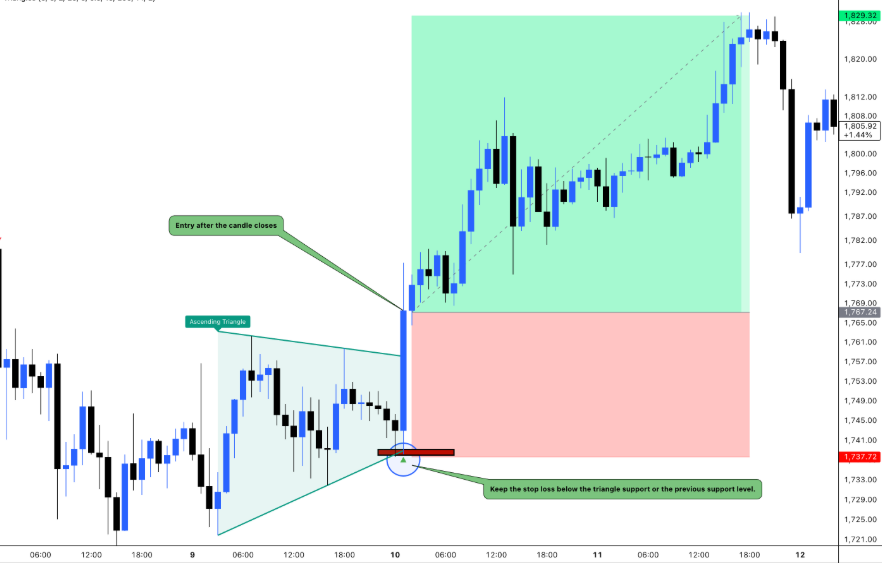
The upper line stays almost flat while the lower line keeps climbing, squeezing price into an ever-tighter range. Then a strong candle closes above the upper line, and the indicator places a small green ▲ beneath it. This is the breakout signal.
In this example, the entry is made only after the breakout candle has closed, with the stop-loss placed below the triangle’s rising support line. The entry, stop and target boxes were drawn with TradingView’s Long Position tool for illustration only. The indicator itself draws just the triangle and the ▲ / ▼ marks.
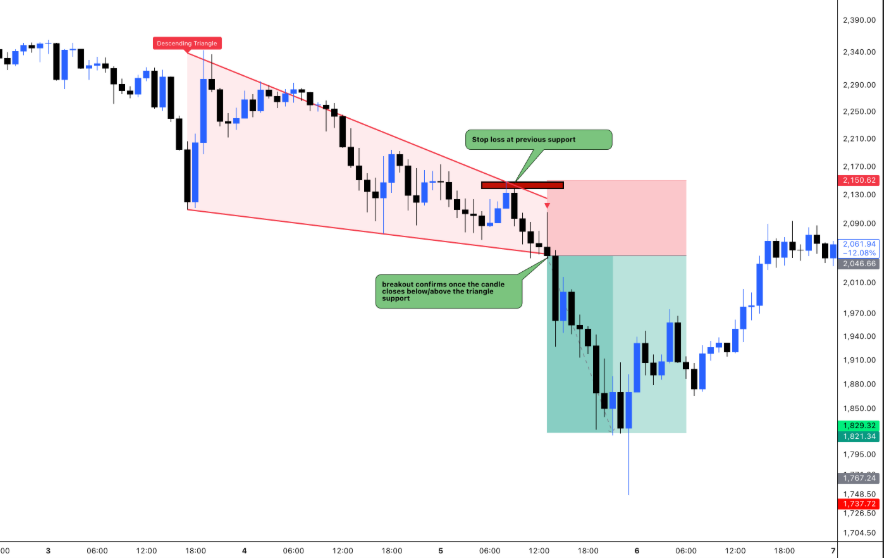
The upper line keeps sloping down (every bounce forms a lower high), while the lower line stays nearly flat as buyers defend roughly the same support zone. The range narrows until a candle closes below the support line, and the indicator places a small red ▼ above it. This is the breakdown signal.
In this example, the short entry is made only after the breakdown candle has closed, with the stop-loss placed above the last swing high inside the triangle. The entry, stop and target boxes were drawn with TradingView’s Short Position tool for illustration only. The indicator itself draws just the triangle and the ▲ / ▼ marks.
Symmetrical triangle example
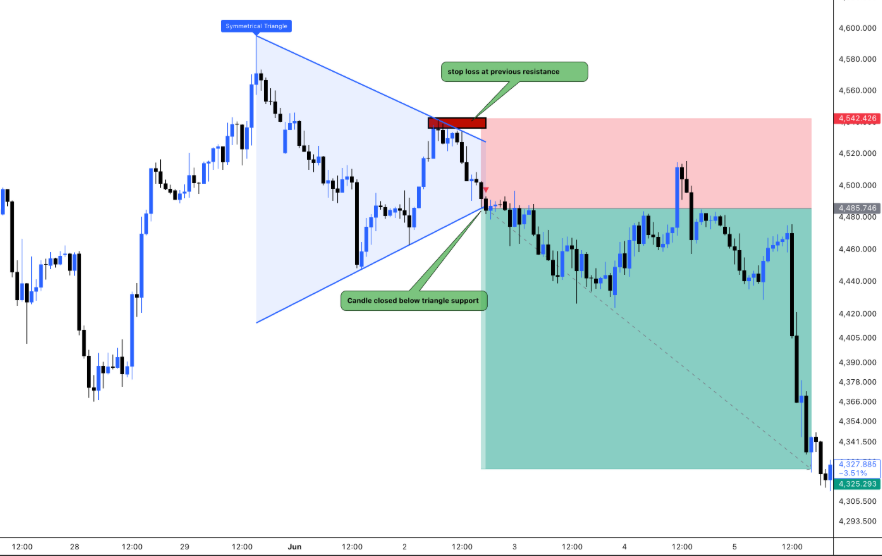
The upper line falls (lower highs) while the lower line rises (higher lows) at a similar angle. Price is squeezed from both sides, and neither buyers nor sellers have control. A symmetrical triangle can break in either direction, so the indicator waits for a candle to close outside the pattern. Here, a candle closed below the rising support line, and a small red ▼ was placed above it. This is the breakdown signal.
In this example, the short entry is made after the breakdown candle closes, with the stop-loss placed above the last swing high (the previous resistance) inside the triangle. Notice that price bounced back up close to the stop before the main move down. This is why the stop belongs beyond a real swing point and not right at the line. The entry, stop and target boxes were drawn with TradingView’s Short Position tool for illustration only. The indicator itself draws just the triangle and the ▲ / ▼ marks.
How to read the chart
- Two coloured lines with a light fill: the triangle itself. Teal = ascending, red = descending, blue = symmetrical (the colours can be changed).
- Label at the start of the pattern: shows the pattern type, for example “Ascending Triangle”.
- Small green ▲ below a candle: breakout. The candle closed above the upper line.
- Small red ▼ above a candle: breakdown. The candle closed below the lower line.
- Dashed lines with “(expired)”: price reached the end of the triangle without breaking out, so the pattern failed.
- Dashed lines with “(no breakout)”: a newer triangle formed before this one broke out, so the indicator stopped tracking the old one.
How it works
- Step 1: find swing points. A swing high is a candle whose high is above the highs of the surrounding candles. A swing low is the opposite.
- Step 2: draw the lines. The upper line connects the latest swing highs, and the lower line connects the latest swing lows.
- Step 3: check the shape. The lines must converge, price must stay between them, and the pattern must be neither too short nor too long. Formations that are not true triangles (wedges, rectangles, lopsided shapes) are skipped.
- Step 4: name the triangle. A line counts as “flat” if it moves less than 25% of the triangle’s height. Since only the shape is evaluated, the logic works identically on every timeframe.
- Step 5: watch for the breakout. When a candle closes outside the triangle, a ▲ or ▼ is drawn and an alert can be triggered.




![[iVISTscalp5]: XAUUSD. Forecast First. Market Reaction Afterwards](https://c.mql5.com/6/1035/splash-preview-777232.png "[iVISTscalp5]: XAUUSD. Forecast First. Market Reaction Afterwards")